
Since late January 2026, the Bitcoin (BTC) price drop dominated headlines because Bitcoin still sets the risk tone for most USDT pairs. Reuters tied the slide to liquidity fears around the incoming U.S. Federal Reserve leadership, including expectations that a smaller balance sheet could drain market liquidity.
That pressure carries into February. Cardano (ADA) price and Ethereum Classic (ETC) price tend to behave like higher-beta sentiment trades, meaning their narratives get quieter when BTC is sliding.
Below is a practical read on BTC, ADA, and ETC, using (1) what changed from late January to now, (2) each coin's 5-year macro trend, and (3) technical signals you can actually watch on your BTCUSDT, ADAUSDT, and ETCUSDTcharts.
What happened from January 30 to February 2, 2026
-
Liquidity became the villain again
Bitcoin broke below $80,000 in thin weekend trading and continued lower. Reuters highlighted the move as part of a broader "risk assets reprice" tied to expectations of tighter liquidity.
Bloomberg framed the break as a confidence hit, with thin liquidity amplifying downside.
-
Institutional flows stopped being a tailwind
On January 30, 2026, U.S. spot BTC exchange-traded funds (ETFs) saw roughly -$509.7 million in net outflows, as per Farside's daily table. That does not "doom" the market, but it removes the cleanest bid that supports the prior uptrend.
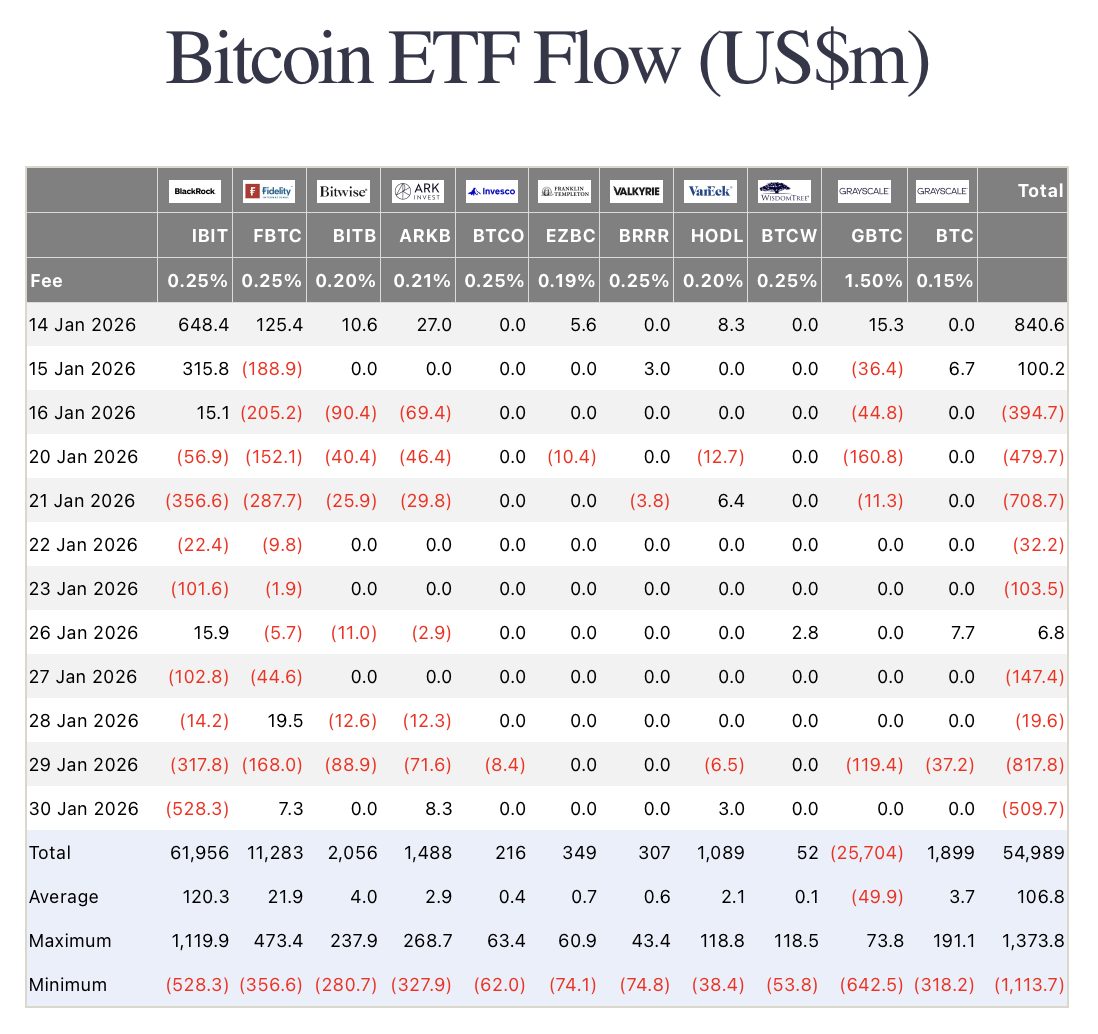
Source: Farside Investors
-
Sentiment is officially ugly
The Crypto Fear and Greed Index is at 14 (Extreme Fear) as of today.
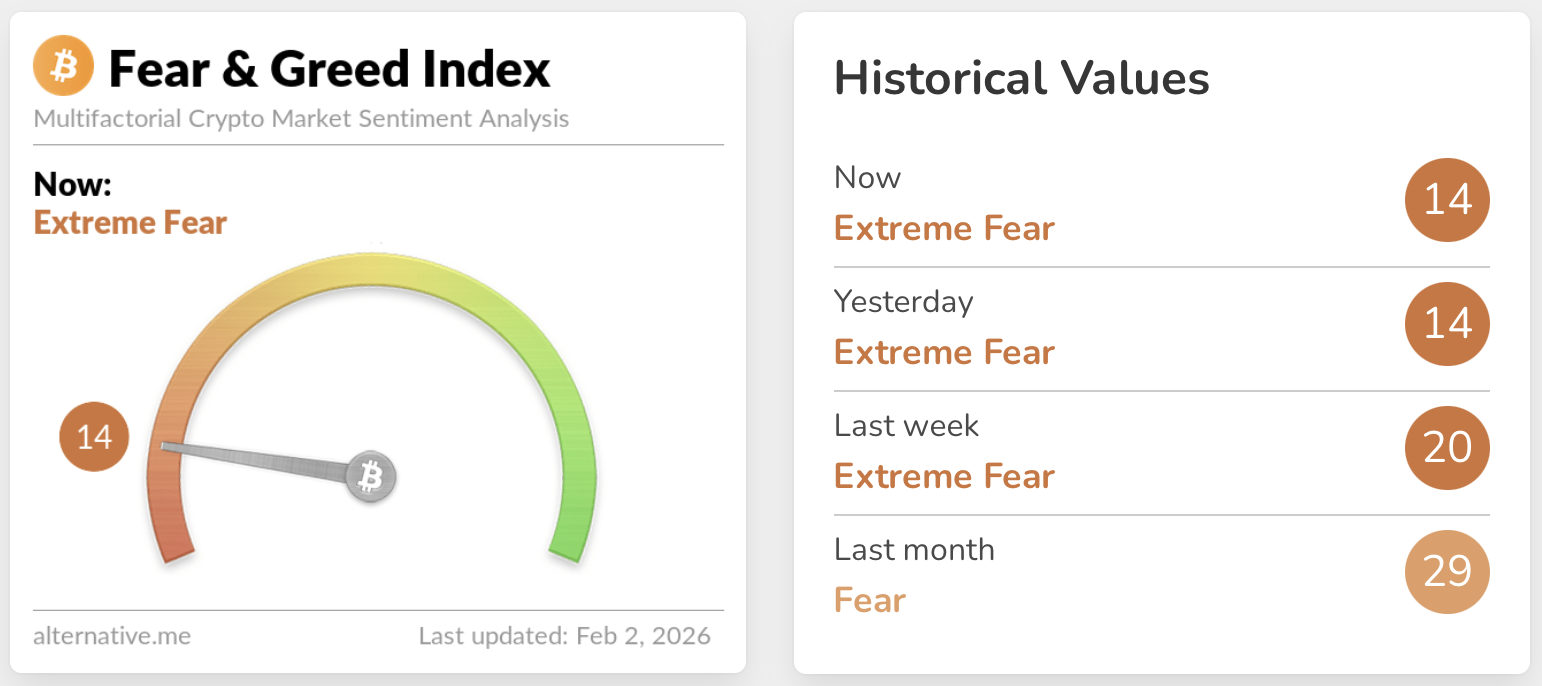
Source: Alternative.me
Sentiment weakened after BTC briefly traded near $97,000 on January 13, then rolled over into late January and early February. Extreme fear is context, not a timing tool. A reading of 14 suggests traders are reacting to price, not building positions patiently.
-
Dominance is screaming "defensive"
CoinGecko shows BTC dominance at 61.67% today, while stablecoins sit at 10.5%. That mix usually means capital is hiding in "BTC + cash," not rotating into higher beta alts.
5-year macro trend check
This is where the "noise vs serious" question gets easier. If you zoom out, you can see which assets have structurally improved and which ones are still fighting for a durable reason to exist.
BTC 5-year macro trend: From speculation to benchmark
Bitcoin's 5-year performance remains strongly positive, with TradingView showing +131.64% over 5 years for BTC-USDT perpetual data.
That matters because it reflects a broader macro shift: Bitcoin is increasingly traded like a benchmark risk asset, with growing institutional interest and ETF-related demands. That makes it more resilient long-term, but also more sensitive short-term to policy expectations.
ADA 5-year macro trend: Governance era and weaker price memory
TradingView shows ADAUSDT perpetual down about -14.60% over 5 years. That is the uncomfortable truth: Cardano's tech and roadmap maturity has not automatically translated into a 5-year price uptrend.
What has changed is the macro narrative. Cardano's roadmap positions Voltaire as the governance and treasury era, aiming for a more self-sustaining system where stake-weighted voting influences development.
If governance and ecosystem integration become visible at the user level, ADA can regain a premium. If not, it trades like a high-beta alt, meaning it usually underperforms when BTC is weak.
ETC 5-year macro trend: The PoW niche with a brutal drawdown
TradingView shows ETCUSDT perpetual up about +62.30% over 5 years, but that number hides massive cyclicality.
CoinGecko lists ETC's all-time high (ATH) at $167.09 in May 2021, and the ETC spot price has fallen to $9.42 (at the time of reporting), a 95% drop since its peak.
ETC's messaging leans into being a proof-of-work (PoW) smart contract platform with censorship resistance benefits. It can still catch bids when PoW narratives rotate back in, but ETC needs sustained demand beyond ideology to behave like more than a high-volatility trade.
Are the panic and sell-offs just "noise," or something more serious?
There is no sign of a protocol-level failure across BTC, ADA, or ETC. The dominant drivers are macro and flows: policy expectations, ETF demand shifts, and forced de-risking.
When liquidity becomes the dominant narrative, markets stop rewarding hope and start rewarding structure.
Reuters noted Bitcoin was tracking toward its longest monthly losing streak in eight years around the January 30th print, and also highlighted that BTC was down about a third from its October 2025 peak.
That's not "crypto drama." That is a macro regime where easy liquidity is no longer assumed, and beta gets punished.
What to look out for when trading BTC, ADA, and ETC
Prices below reflect the Toobit spot charts at the time of writing.
Bitcoin signals
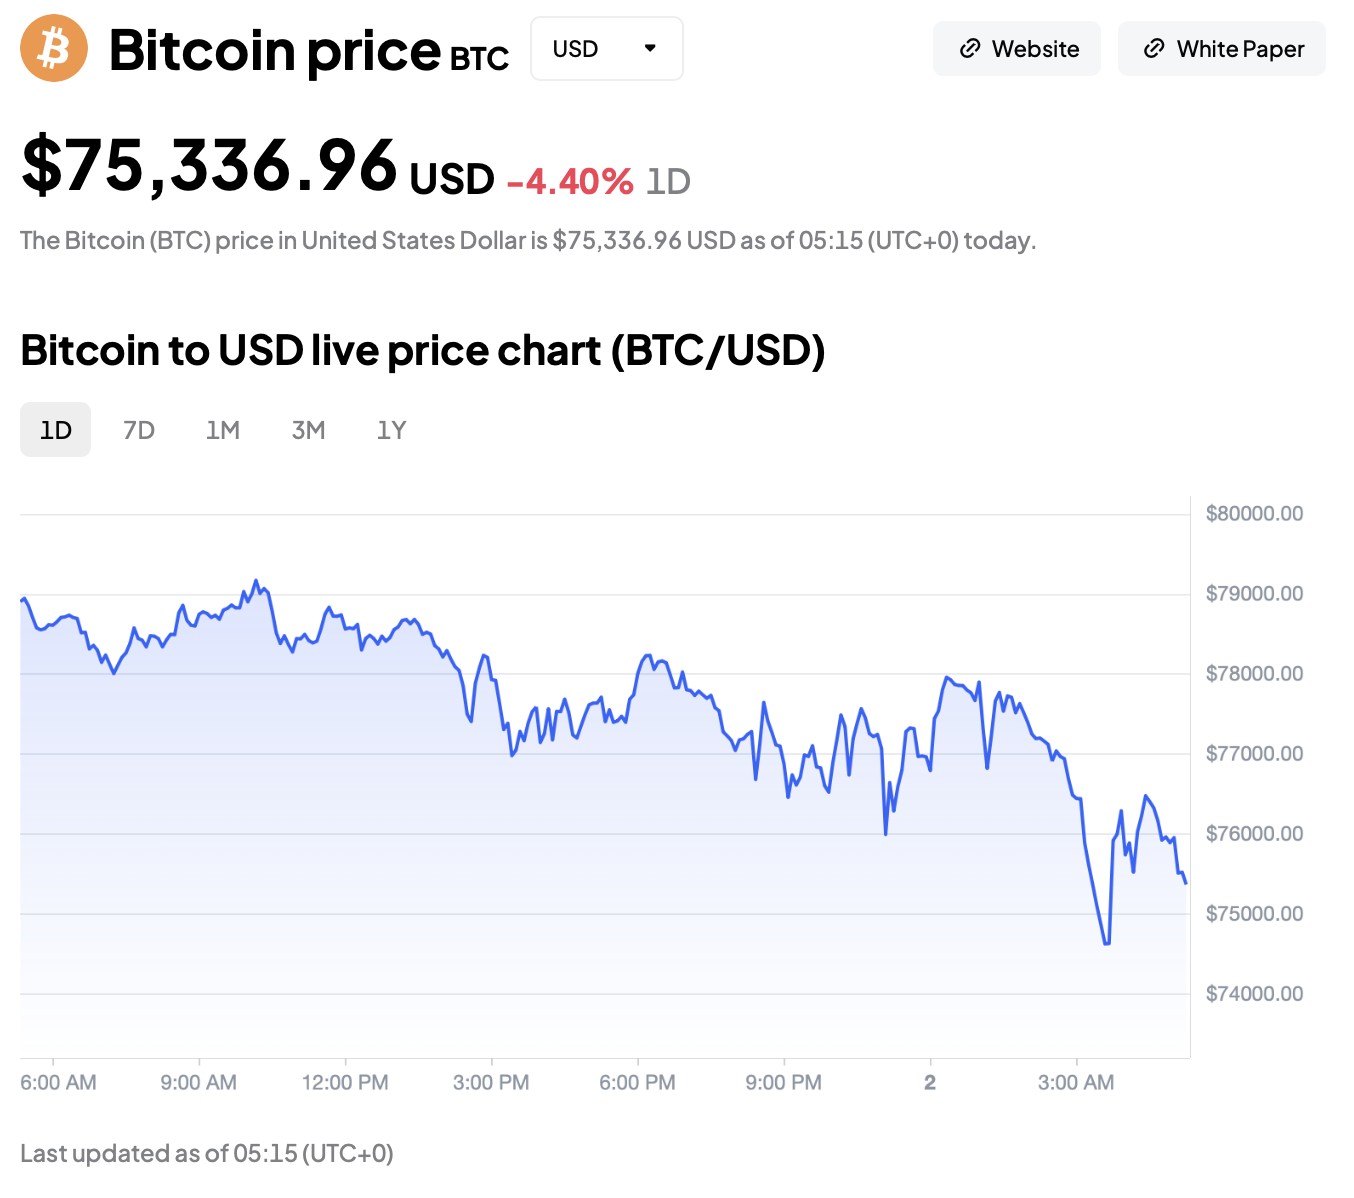
BTC-USDT current price reference. Source: Toobit
Toobit shows BTC around $75,336.96, with BTC price briefly touching $74,000s in the early hours of today.
Signals to watch for:
-
Reclaim and hold key breakdown zones on the daily chart
If BTC reclaims the $80,000 breakdown area and holds it for multiple daily closes, that's the first sign the panic is easing. -
ETF flow trends
One red day is noise. A week of persistent outflows is structure. Watch whether daily flows stabilize after the late-January negative spike. -
Dominance direction
If BTC dominance keeps rising while BTC price falls, that often means alts are being sold faster, and risk appetite is still shrinking. -
Sentiment tools like Crypto Fear and Greed Index and BTC rainbow chart
The BTC rainbow chart is a fun long-term lens, but BlockchainCenter explicitly says it has no scientific basis and is not investment advice. Use these tools as a sentiment temperature check, not as a target generator.
Cardano signals
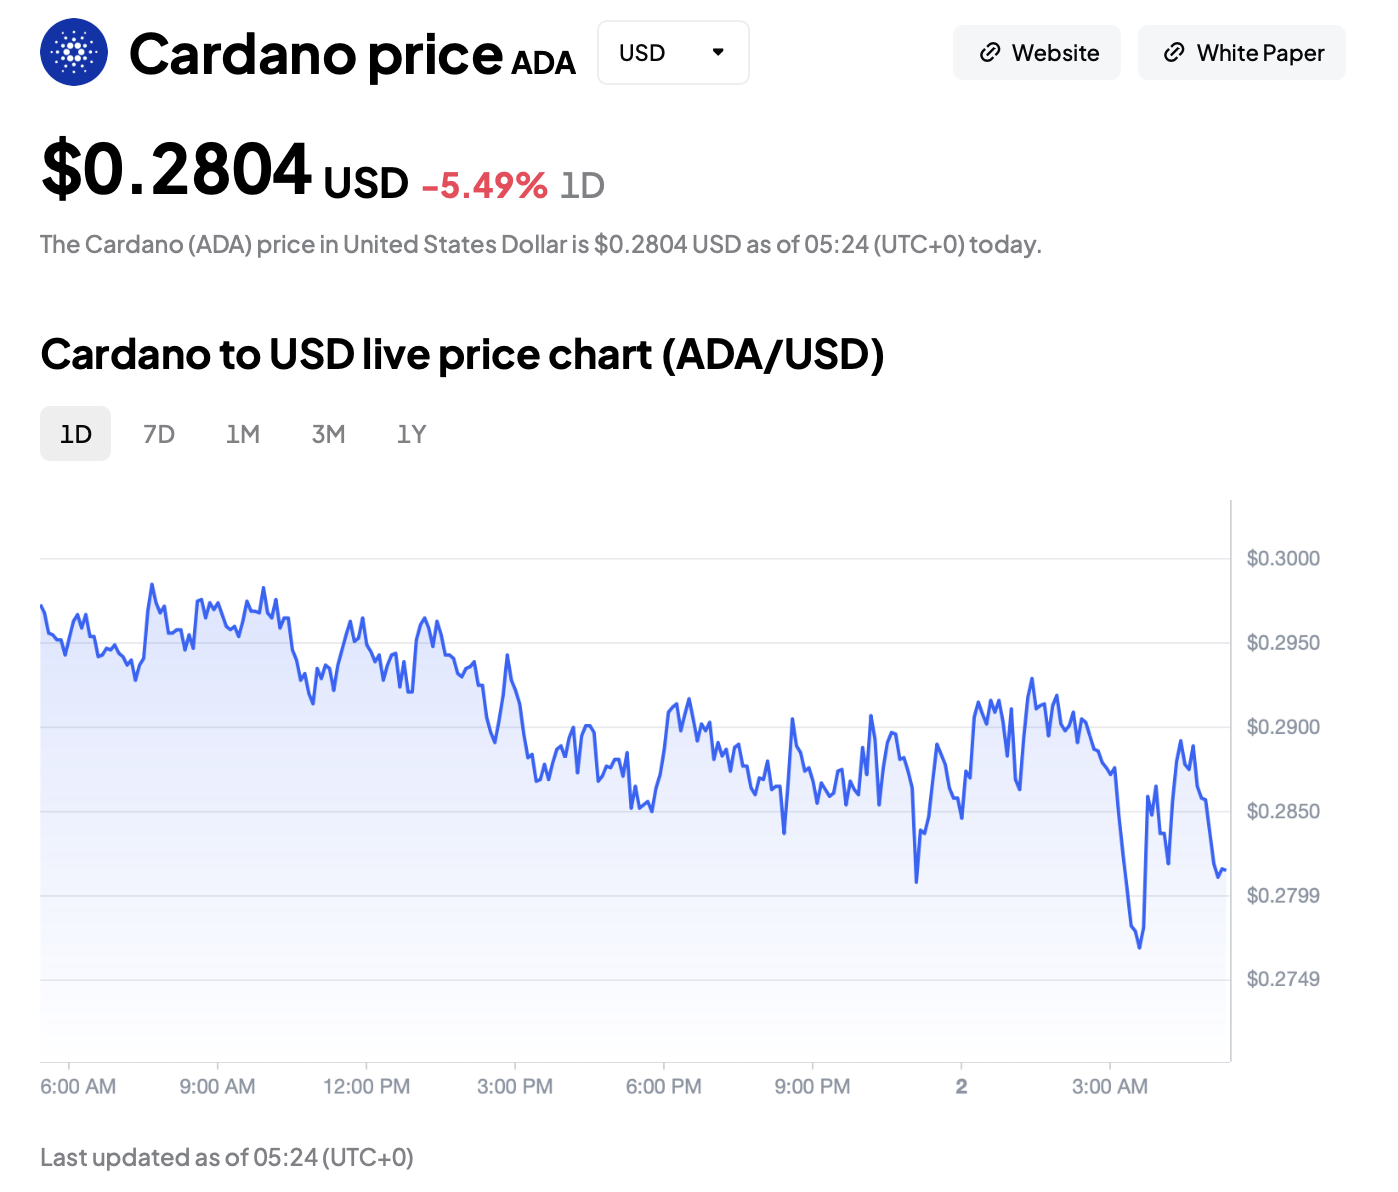
ADA-USDT current price reference. Source: Toobit
Toobit shows ADA around $0.2804, with ADA price briefly touching $0.2769 in the early hours of today.
Signals to watch for:
-
Relative strength vs. BTC
In choppy markets, an ADA rally in USD is more likely to stick if ADA is also strengthening versus BTC. -
Market structure shift: higher low, then higher high
A single bounce is not a trend. A higher low after the bounce is the first signal that sellers are losing control. -
Governance execution as the macro fundamental
Cardano's Voltaire direction is about governance and treasury becoming operational levers. If governance participation improves and tooling becomes easier, that's the kind of "fundamental change" the market can eventually price. -
ADA target price framework that is not fantasy
Treat "ADA target price" as a ladder of confirmations. In volatile markets, ADA rallies often fade unless ADA reclaims the 50-day Exponential Moving Average (EMA), then holds $0.30 on a retest.
ETC signals
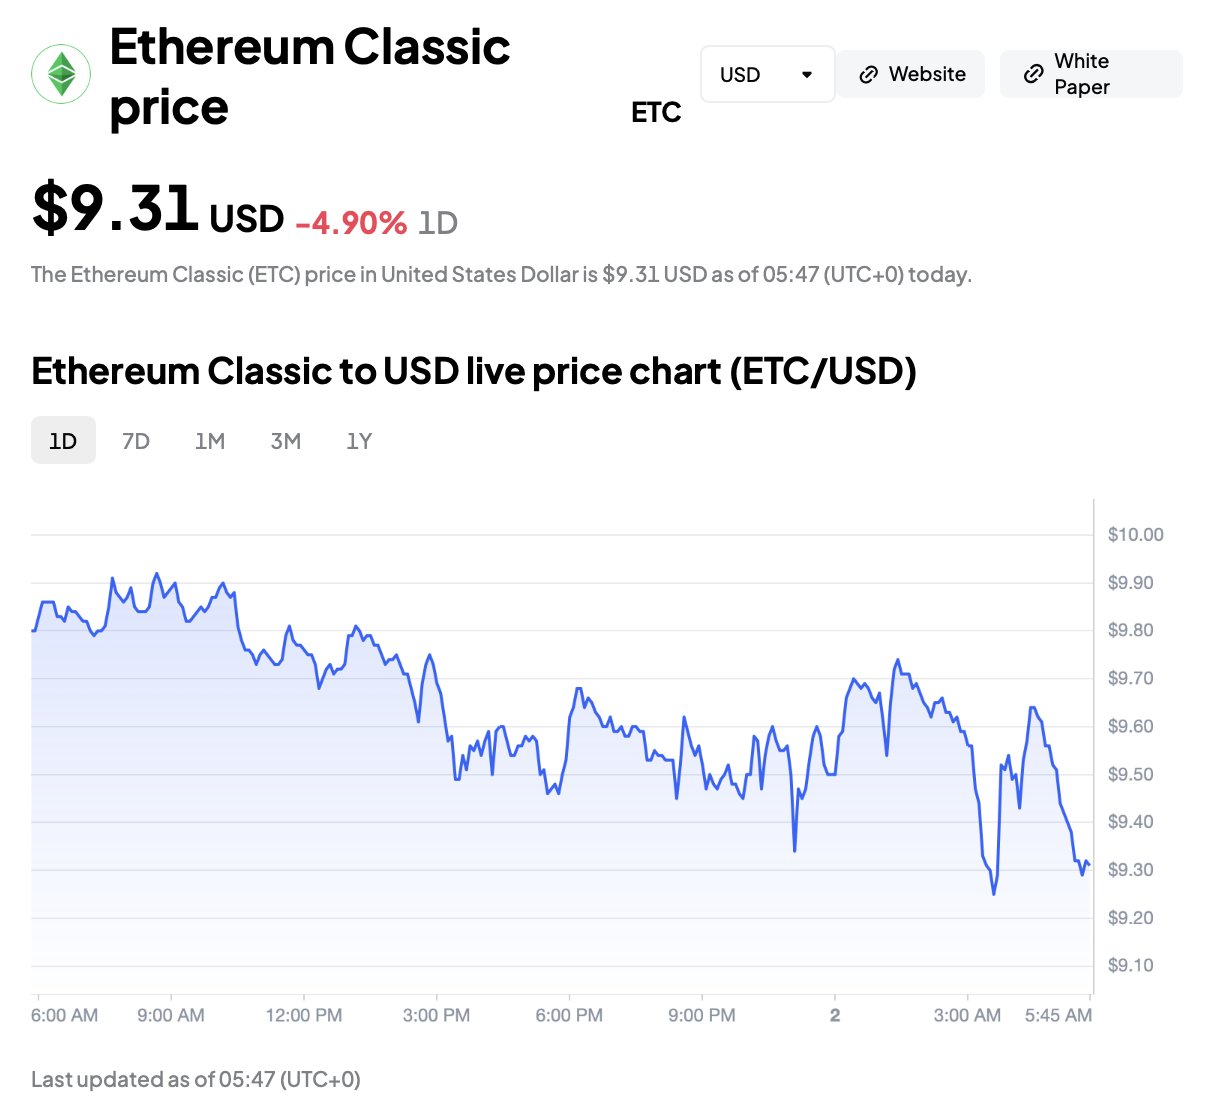
ETC-USDT current price reference. Source: Toobit
Toobit shows ETC around $9.31, with ETC price briefly touching $9.25 in the early hours of today.
Signals to watch for:
-
ETC's trend is a "rotation check," not a market leader
ETC often strengthens when PoW narratives heat up. Its own messaging emphasizes PoW smart contracts and mining distribution. -
Demand confirmation through volume expansion
For ETC coin price moves, volume matters more than commentary. If ETC breaks a key resistance without volume, it is usually a fakeout. -
Zoom-out reality check
ETC's ATH was nearly 5 years ago at $167.09 (May 2021). To reclaim meaningful ground, ETC likely needs more than a PoW headline cycle, it needs sustained demand and liquidity.
The bottom line
The cleanest way to read this volatility is not "bullish vs bearish," but liquidity vs. structure.
-
BTC price is reacting to macro liquidity expectations and institutional flow dynamics, which is why ETF flows and dominance matter as much as any candle pattern.
-
ADA price needs proof of execution, and the governance era narrative will only re-rate if users can feel it, not just read about it.
-
ETC price is the PoW sentiment instrument. It can spike, but it needs sustained demand to graduate from "rotation trade" to "investment thesis."
Right now, the market is not asking for optimism. It is asking for proof.
Watch flows, watch structure, and let price confirm the story. If BTC stabilizes and flows normalize, ADA and ETC will get their chance to outperform, but the market will signal it on the chart before it shows up in headlines.


