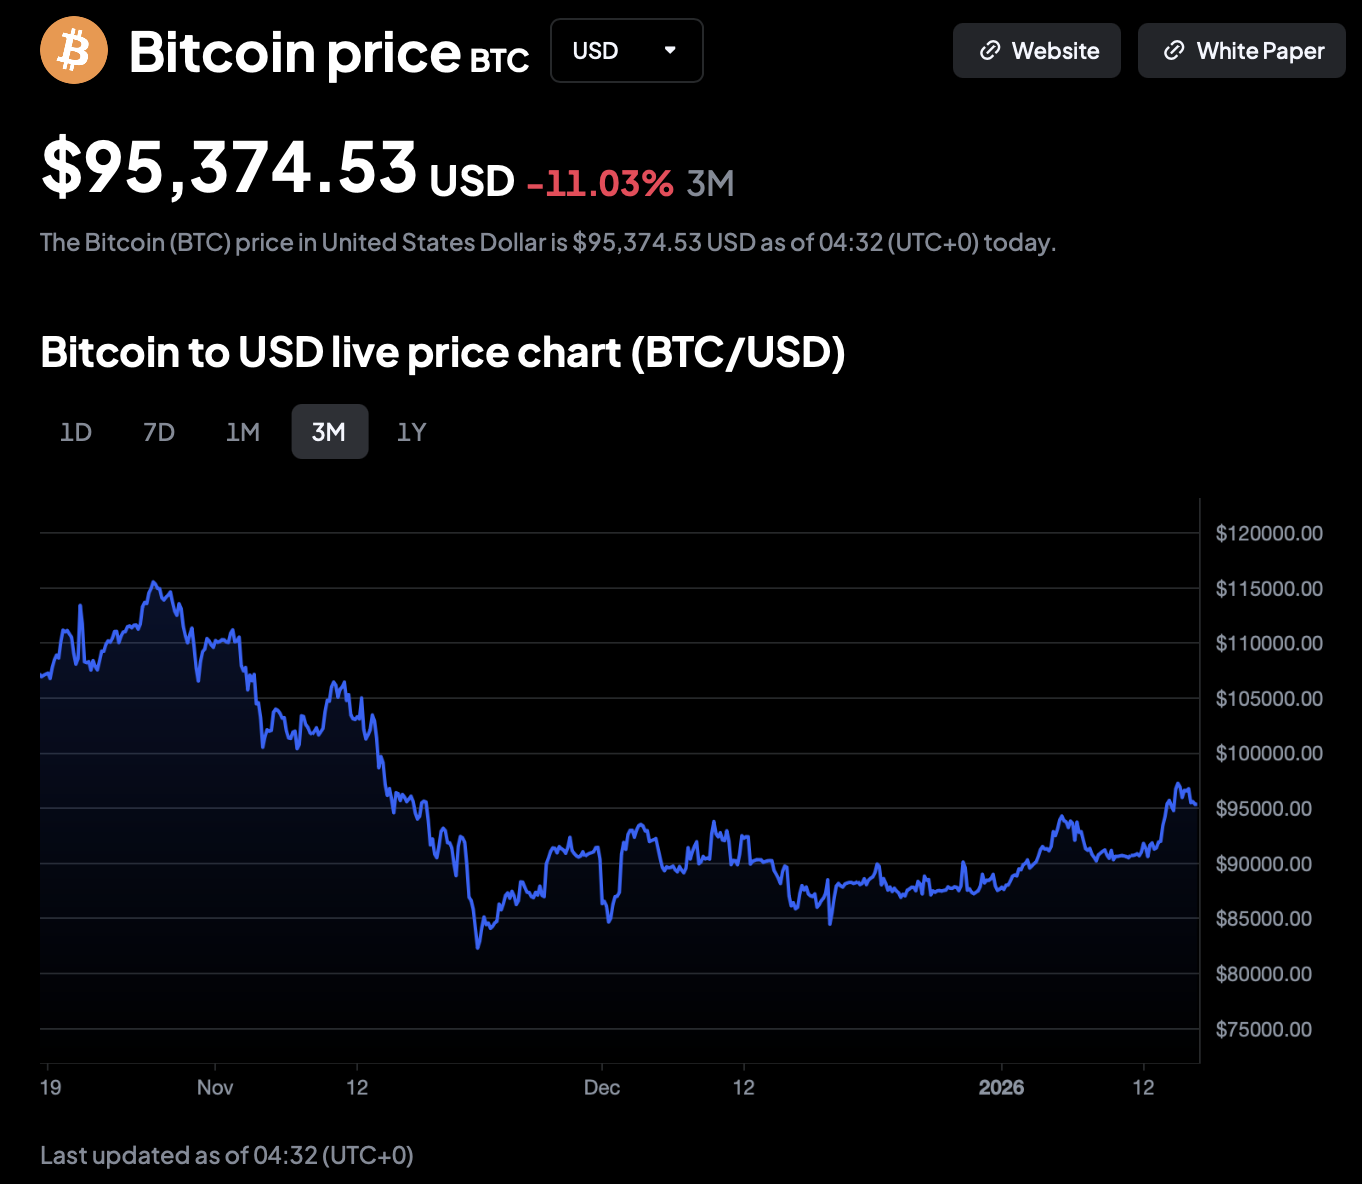
Bitcoin (BTC) pushed through $97,000 on January 14, 2026, snapping out of a tight multi-month range and putting $100,000 back into focus.
After spending much of the past quarter consolidating, the move stood out not just for its size, but for its timing. On the day, BTC traded up to around $97,683 across major pricing feeds, marking its highest levels since mid-November.
That breakout did not come from a single catalyst. It was the product of macro relief, policy-driven confidence, institutional flows, and a derivatives positioning squeeze that turned a steady bid into a fast move.
This deep dive explains:
-
Why BTC broke out when it did
-
How the move accelerated (and what was "mechanical" vs "real demand")
-
Which sentiment and derivatives signals mattered most
-
How to judge whether this trend can extend through end-January or cool into consolidation
-
What the "is this the time to enter or exit" question looks like through a risk lens, not a headline lens
Setting the scene from late 2025 to January 2026
From October 2025 into early January, BTC spent weeks moving sideways (and even falling below $81,000), repeatedly stalling near the same resistance band.
That kind of price compression tends to build pressure: Once the ceiling gives way, the move often accelerates quickly because positions built around selling the range get forced to unwind all at once.
LMAX Group's market strategist Joel Kruger mentioned that reclaiming $95,000 mattered both psychologically and technically, and a sustained break would put $100,000 back in play.
That is exactly what 14 January delivered. BTC cleared the level that had capped price, and the market switched from "range rules" to "trend rules" in a single session.
Macro and policy forces behind BTC's January breakout
The first layer of the 14 January move came from macro alignment, not speculation.
Softer inflation changed the risk math
The cleanest macro input was inflation. U.S. consumer price index (CPI) data came in softer than many expected. Reuters highlighted a 0.2% month-on-month CPI, with year-on-year measures in the mid-2% range, and noted how that fed rate cut expectations.
Why this matters for BTC
-
Softer inflation tends to reduce the probability of restrictive policy staying in place for longer
-
Lower expected real rates increase the attractiveness of risk assets and long-duration exposures
-
BTC often benefits when the market shifts from "tightening risk" to "normalization risk"
Regulation headlines reduced uncertainty premium
Alongside macro, policy headlines helped. Barron's linked the rally to optimism around U.S. digital asset legislation, reporting that the Senate Banking Committee would review the Digital Asset Market Clarity Act and that Securities and Exchange Commissions (SEC) Chair Paul Atkins endorsed the bill in pro-framework terms.
Investopedia also pointed to the combination of the inflation report and the Clarity Act narrative as a reason strategists expected Bitcoin's move to have "legs". Tony Sycamore, analyst at IG Australia, echoed the same sentiment and said that BTC may "potentially [overtake its] 200-day moving average, which currently stands at $106,115" if this momentum continues.
Evidently, clearer regulatory direction lowers the discount rate applied to long duration assets, and Bitcoin sits at the extreme end of that curve. Less policy ambiguity invites capital that had previously stayed sidelined.
Institutional flow helped turn a rally into a breakout
Institutional demand added structure to the move. Bloomberg reported that spot Bitcoin exchange-traded funds (ETFs) saw roughly $760 million in net inflows on Tuesday, the biggest daily intake since October, and named Fidelity's fund as the largest recipient at about $351 million.
This matters because a tightening range becomes vulnerable when:
-
Passive or semi-passive vehicles absorb supply consistently
-
Short-term sellers get exhausted
-
Any breakout triggers forced buying from hedged shorts
Flows do not guarantee direction day-to-day, but they can tilt the structure so that once resistance breaks, there is less supply waiting above.
Risk hedging supported the move
Finally, recent geopolitical tensions in Venezuela and Iran, as well as the Fed independence debate, have supported Bitcoin's role as a macro hedge. While not the primary driver, it helped reinforce the narrative that the move was grounded in broader risk repricing rather than isolated momentum.
Macro conditions did not create the breakout alone, but they removed the barriers that had previously capped it.
Sentiment and positioning signals that hinted at the move
Before BTC price broke $97,000, sentiment had already shifted.
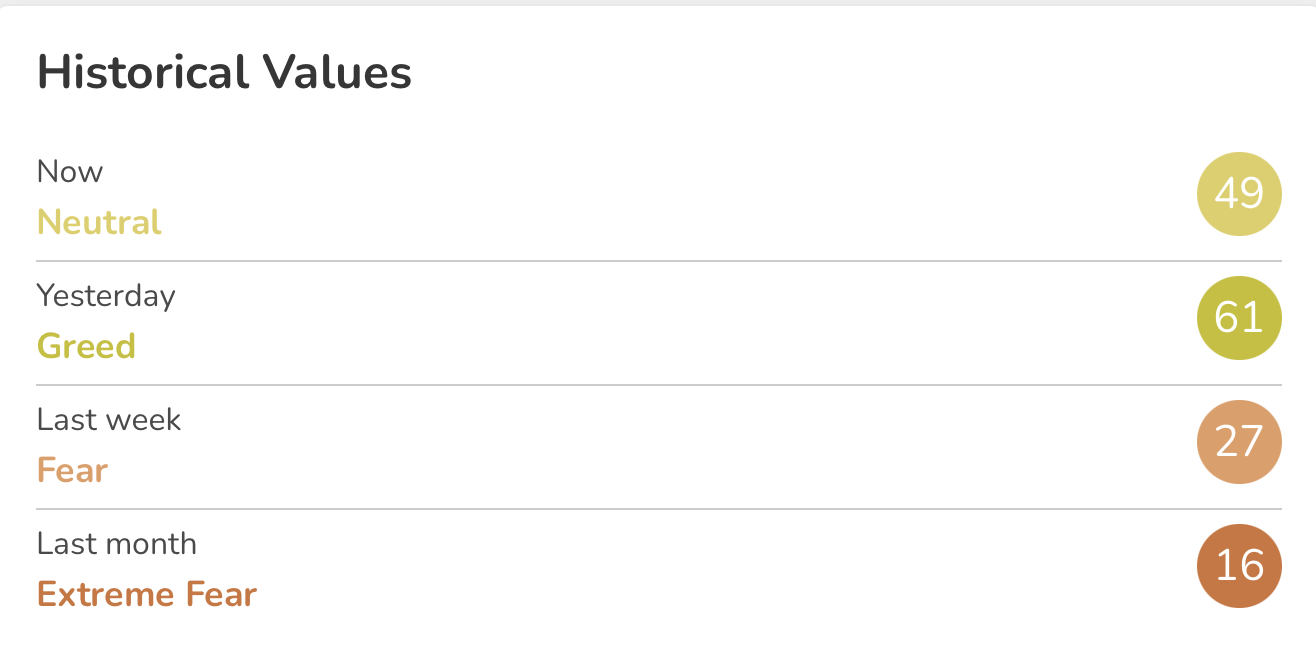
The Crypto Fear & Greed Index had climbed steadily from Fear toward Neutral in early January. That transition zone is historically important. Markets are most fragile at extremes, not during recovery. As fear fades, participants become more willing to hold risk rather than rush to exits.
Mechanical fuel shorts got squeezed
Breakouts often look "fundamental" after the fact, but the intraday acceleration is frequently mechanical.
It was reported that BTC clearing $94,500 wiped out roughly $500 million in short positions. The move was framed as a breakout that rejuvenated risk appetite.
Bloomberg similarly noted that in options markets, the rally erased more than half a billion dollars in bearish bets.
This move can look sudden even when the setup has been brewing for weeks:
-
Shorts cluster around known resistance
-
A break triggers stops and liquidations
-
Forced buying adds velocity on top of real demand
In other words, the "why" can be macro and flows, but the "how" often includes forced positioning.
On the derivatives side, futures funding rates were constructive but restrained. Longs were returning, but not aggressively. Open interest was rising alongside price rather than ahead of it, a sign that positioning followed strength instead of front running it.
Liquidations amplified Bitcoin's move
The breakout forced short positions clustered near resistance to close, accelerating the move. Liquidations did not start the rally, but they amplified it once key levels gave way.
Just yesterday, the Crypto Fear & Greed Index climbed to 61, flipping back into Greed for the first time since the October selloff. Funding rates turned modestly positive, and price acceptance above prior resistance confirmed that the move had changed the market's tone.
Today's score slid down to 49 as Bitcoin prices stabilizes around $95,000.
Is Bitcoin going to hit $100K and is this the time to enter or exit?
The honest answer is that $100,000 is a psychological magnet, not a guarantee. BTC traded as high as about $97,694 on 14 January, according to Bloomberg, putting $100,000 within striking distance in headline terms.
However, it is dangerous to time market entrances or exits based on emotions. If you're experienced in technical analysis or other methods of analysis, use that. If not, here is a beginner-friendly, practical framework for you to start with:
-
Separate direction from risk
Direction is the trend; risk is how the trend is being financed.
In constructive advance, you want to see:
-
Price holding above reclaimed levels like $95,000 (a level multiple outlets highlighted as technically meaningful)
-
Funding not racing higher too quickly
-
Open interest growing, but not outpacing spot activity
In fragile advance, you often see:
-
Funding surging as late longs pile in
-
Open interest ballooning while price becomes more erratic
-
Sharp wick-downs that flush over-levered positions
This is why derivatives data matters for general readers. It is the cleanest window into whether markets are buying with conviction or with leverage.
-
Use MACD to describe momentum, not to predict tops
To make the analysis more credible without pretending indicators are magic, position moving average convergence/divergence (MACD) correctly.
MACD is a trend and momentum indicator, and it is most useful after long consolidation, because it helps confirm that momentum has genuinely shifted.
-
A bullish MACD crossover after range compression is often consistent with early trend formation.
-
A flattening MACD does not automatically mean reversal, it can also signal consolidation.
For readers, the takeaway is simple: Momentum indicators validate structure, they do not replace risk management.
-
The enter or exit question depends on time horizon
This is where you can guide behavior without giving generic advice.
-
Short-term traders should focus on levels and leverage If funding spikes and price stretches away from support, risk rises.
-
Medium-term participants should focus on structure Reclaiming $95,000 and holding higher lows matters more than a single intraday print.
-
Longer-term allocators should focus on macro and policy trajectory Inflation, rate expectations, and regulatory clarity are what reshaped the backdrop this week.
Will this trend push through January?
To assess whether momentum persists, focus on behavior, not predictions.
First, watch how BTC reacts to pullbacks
Healthy trends defend higher lows quickly. If dips below recent support are absorbed with rising volume, trend structure remains intact. Breakouts fail when price briefly tags above resistance and then falls back into the prior range.
Breakouts stick when:
-
Price holds above the breakout zone
-
Pullbacks find buyers quickly
-
Volume supports the move on upswings
Because multiple outlets framed $95,000 as a key threshold reclaimed during this move, it becomes a natural reference for "acceptance vs rejection."
Second, track funding and open interest together
Gradual increases in funding and open interest signal sustainable positioning. Sudden surges often precede volatility. If funding turns aggressively positive without corresponding spot demand, risk rises.
Third, observe sentiment changes
A Fear and Greed reading drifting from 61 toward the mid-70s without a price pullback would suggest overheating. A stable reading while price consolidates suggests acceptance, and can fall within the range of 50 to 65.
Finally, monitor the mechanical tells of a tired move
Because this breakout included forced buying, you want to see whether the market can keep rising without constant liquidation fuel.
If price continues growing while:
-
Liquidation spikes fade
-
Spot participation stays steady
-
ETF flows remain constructive
It is then evident that the trend is more likely to be sustained rather than purely squeeze-driven.
On flows, the ETF data point is not subtle: Roughly $760 million in a single day can change near-term supply dynamics, especially after a period of range compression.
A breakout is not a signal to rush
Bitcoin's move above $97,000 on 14 January was not an accident. It was the result of macro relief, improving sentiment, disciplined positioning, and a clean technical release from consolidation.
At the same time, strong trends reward patience more than excitement. Chasing price after a breakout often leads to poor entries, while ignoring risk data leads to emotional decisions.
If BTC runs toward $100,000, the question is not whether the number is possible. It is whether markets can keep pushing higher without leverage sprinting ahead of demand.
Momentum is back for Bitcoin. Stay objective and let the data confirm the next leg.
