Is Ethereum Classic finally playing catch-up in 2026?
Ethereum Classic (ETC) is one of the few chains whose origin story is literally a split decision. While newer networks pitch speed and scalability, ETC’s pitch is simpler: stick to the original rules and do not rewrite history.
Admirable? Maybe. Profitable in 2026? That is what traders want to know. Let us start with the basics and work forward.
What is Ethereum Classic (ETC)?
Ethereum Classic is the original Ethereum chain that continued after the 2016 DAO hack fork. When the Ethereum community voted to change the ledger to recover stolen funds, part of the network rejected that move and stayed on the unchanged chain. That chain became Ethereum Classic.
ETC runs on proof-of-work (PoW) like Bitcoin (BTC), not proof-of-stake (PoS). That alone makes it stand out today. Their guiding idea was simple: code is law. If transaction history can be rewritten, they argued, the system depends on human intervention rather than strict rules. ETC still follows that principle today.
ETC price history and performance overview
ETC price history
The price of ETC has lived several lives:
-
2016–2019: Mostly low-liquidity drift
-
2021: Major spike during the PoW and “ETH alternative” narrative cycle
-
2022–2024: Long compression phase
-
2025: Range behavior with short volatility bursts
ETC’s all-time high (ATH) sits near $176 (May 2021). That move was driven less by ETC adoption and more by spillover speculation from Ethereum’s rally and mining rotation themes.
Its all-time low (ATL) sits around $0.45 in July 2016, shortly after the Ethereum–Ethereum Classic split and its first exchange listings. Prices were thin and volatile at the time because liquidity was low and most market participants were still deciding whether the original chain would survive.
Since then, ETC price charts show a long decay curve followed by stabilization. That is not bullish or bearish by itself; it is typical of assets that lose narrative leadership but keep a loyal base.
ETC’s latest performance
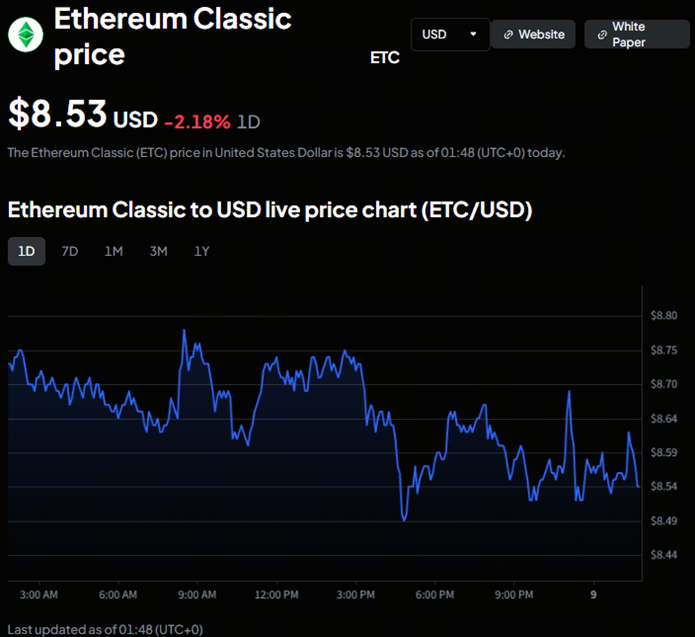
ETC price from Toobit, as of February 9, 2026, 01:48 UTC
Based on the chart, ETC is trading at $8.53. Intraday price action shows a gradual drift lower, with a sharper dip in the late afternoon toward the $8.50 area, followed by a modest rebound.
The range has been tight overall, roughly between $8.49 and $8.78, which suggests consolidation rather than a strong trend. In short, ETC’s latest price movement points to short-term weakness but stable support near the mid-$8.50 zone.
Current market snapshot (February 9, 2026, 09:49:36 UTC+8)
As of February 9, 2026, the price of ETC is trading at $8.53 on the ETC/USDT pair.
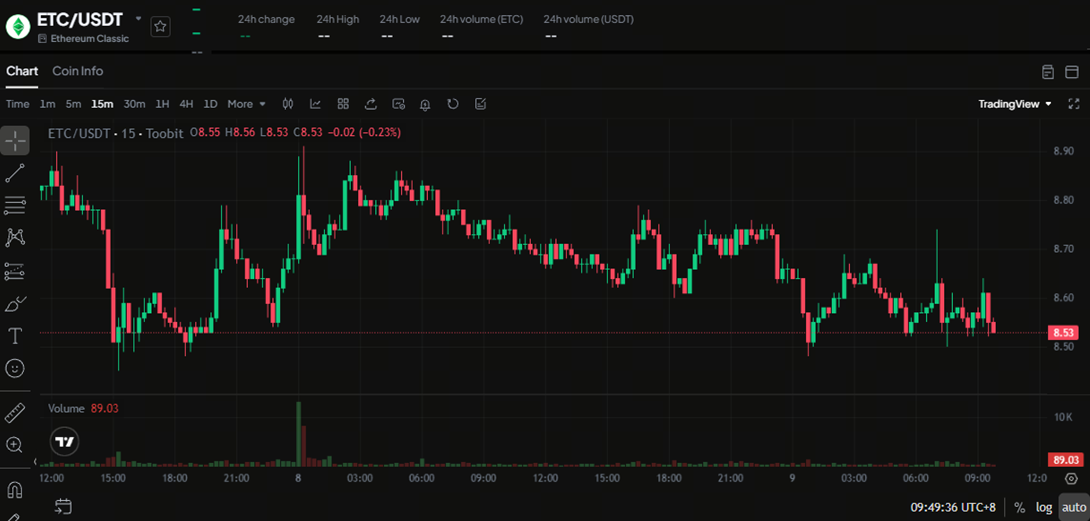
Using the attached ETC/USDT chart data:
-
ETC/USDT price: ≈ $8.53
-
24h change: about -0.23%
-
24h high: ≈ $8.56
-
24h low: ≈ $8.53 (tight range session)
-
Intraday structure: Sideways with mild downward drift
-
Short-term volume: Light, with one earlier spike visible on chart
Today’s ETC price movement shows a compressed range. That usually means one of two things: either traders are bored, or a larger move is loading quietly. Crypto has a habit of choosing drama over boredom.
Market cap and circulating supply figures continue to place ETC in the mid-cap tier, far below ETH, but still liquid enough for institutional desks to trade without moving price too much.
On-chain and technical analysis
Support and resistance
Looking at recent ETC price charts, the market is testing a horizontal support area near $8.50. This level has held multiple times since the late-2025 pullbacks and is acting as a short-term floor again. Buyers have stepped in around this zone during recent dips.
On the upside, near-term resistance sits around $8.80–$9.00, where rallies have stalled. A clean break above that range would be needed to shift the short-term structure from sideways to upward. Until then, ETC/USDT remains range-bound between support near $8.50 and resistance near $9.
Momentum indicators
On the daily timeframe, the Relative Strength Index (RSI) sits near neutral, with no strong bullish divergence. During the early February sell-off, the ETC cryptocurrency price printed a slightly lower low, while RSI formed a higher low. That setup can signal that selling pressure is fading.
RSI is currently near the mid-range, not overbought and not deeply oversold. This suggests momentum is stabilizing rather than trending strongly in either direction. Traders usually read this as a pause phase, with room for a move once volume returns.
Moving averages and volume
The price of ETC is trading close to its short- and mid-term moving averages, with no strong separation above or below them. That confirms the current sideways structure. The 50-day average is flattening, while the 200-day average is also leveling out, which often happens during long consolidation periods.
Volume patterns show brief spikes on sell-offs, followed by lighter participation on rebounds. That tells us recent ETC price movement has been driven more by short-term reactions than steady accumulation. For a stronger trend to form, volume would need to expand on upward moves, not just on drops.
On-chain cues
One steady signal comes from network security data. ETC hash rate remains near record levels, based on public dashboard trackers.
After Bitcoin’s halving cycles, some mining capacity has rotated toward other PoW chains, including ETC. A higher hash rate strengthens network security and lowers the risk of the 51% attacks ETC faced in earlier years.
On-chain activity shows stable but not growing transaction counts. This supports a consolidation thesis rather than a breakout thesis, for now.
ETC price prediction and outlook
The most likely path for ETC price in 2026 is continued range trading between $7 and $12. Current ETC price charts show weak trend strength, with repeated rejection near resistance and steady buying near support in the high-$7 to low-$8 zone.
In this base case, ETC/USDT mostly follows broader crypto market moves rather than leading them. Breakouts tend to fail without strong volume, and rallies often fade quickly.
Historical exchange data from platforms like CoinMarketCap and CoinGecko shows this pattern clearly: ETC price movement often compresses for long stretches, then reacts sharply during market-wide volatility.
The bullish case depends less on ecosystem growth and more on narrative shifts. A move toward $15–$20 becomes more realistic if PoW assets return to favor, mining economics improve for ETC, or hash power rotates from other chains.
In past cycles, ETC has rallied when traders looked for PoW alternatives or when miner flows changed after Bitcoin events. These rallies are usually fast and volume-driven, but they rarely last long. They tend to be momentum trades, not slow uptrends built on steady adoption.
The bearish case is tied to liquidity and relevance risk. If ETC loses the $7 support area and trading volume stays thin, price could drift toward $5–$6.
ETC does not have the same developer growth or application layer depth as leading smart contract platforms, so it can underperform when market attention narrows. In those periods, capital often rotates to chains with stronger usage metrics, leaving ETC range-bound or sliding.
Looking across prior cycles, ETC rallies are typically narrative-driven and short-lived rather than gradual climbs. That makes ETC price prediction better suited to cycle and sentiment analysis than long-term growth models.
In practical terms, ETC behaves more like a conditional trade than a compounding asset: it moves quickly when the right story and volume appear, and otherwise tends to drift sideways.
This article is for informational purposes only and does not constitute financial advice. Always do your own research (DYOR) before making any decisions.
Key milestones for ETC
-
July 2026
ETC launched after the DAO hack fork. The chain continued with the original ledger while Ethereum moved to the modified chain.
-
August 2020
The ETC network suffered repeated 51% attacks. This led to security upgrades and monitoring changes.
-
May 2021
ETC hit its recorded ATH around $176 during the 2021 bull market, driven by PoW rotation trades and spillover from Ethereum-related narratives.
-
September 2022
After Ethereum shifted to PoS, part of the mining community moved to ETC, lifting network hash rate and improving security metrics.
-
2022–2024
Security and infrastructure upgrades continue, with a focus on reducing attack risk and improving node reliability.
-
Early 2026
Consolidation near mid-single digits as ETC/USDT trades in a tight range, with price action driven mainly by broader crypto market moves and liquidity cycles rather than chain-specific adoption.
ETC does not depend on frequent upgrades to drive price. It depends on macro narrative rotation, especially if PoW assets return to favor.
Community sentiment and ETC news
ETC has a committed community; smaller than Ethereum’s, louder than you would expect.
Sentiment today is pragmatic:
-
Supporters value immutability and PoW continuity
-
Critics question developer velocity and ecosystem growth
Analyst coverage is more measured: it tends to mention ETC mainly in relation to Ethereum or PoW debates, not as a primary innovation chain. That tells you where it sits in the market hierarchy.
Trading behavior points to cautious accumulation rather than aggressive buying. Positioning looks gradual, with traders adding near support levels and trimming into rallies, instead of chasing breakouts.
The bottom line
Ethereum Classic is not trying to be the future of smart contracts. It is trying to be the chain that never changed the past. That gives it identity and limits.
For traders, ETC price prediction is less about adoption curves and more about cycle timing. The simple rule still applies: watch structure before momentum. Avoid chasing breakouts after sharp spikes.
ETC has historically moved in bursts, with gains often starting during quiet accumulation periods rather than during crowded rallies.
For everyone else? It is proof that in crypto, even the forked road still has traffic.
How to start trading Ethereum Classic (ETC)
Ethereum Classic keeps the original Ethereum chain alive with a straightforward, proof-of-work design. If you’re ready to trade ETC/USDT and follow ETC price moves in real time, Toobit makes it smooth from start to finish.
