Tensor 價格
Tensor 市場資訊
24小時最低價 --
24小時最高價 --
Tensor 即時價格(今日 USD)
1 個 TNSR 現值多少 ?
Tensor 價格歷史
為什麼 Tensor 的價格總是波動?
任何在公開市場上交易的資產(包括 Tensor)的價格,都是由供需所決定的。如果在某個價格點上,想購買 Tensor 的人多於想出售的人,價格將會上漲。相反,如果想出售 Tensor 的人多於想購買的人,價格則會下跌。
加密資產買方與賣方之間的這種持續平衡,是價格波動的根本原因,在數位資產領域中,這種波動有時可能會非常迅速。
哪些因素會影響 Tensor 價格的表現?
Tensor 的表現可能會受到其技術與社群相關的多項關鍵因素影響。Tensor 底層技術的持續發展十分重要,因為引入新功能或提升效率的更新可能引發正面的關注。另一個值得注意的因素是採用率,也就是新的使用者開始持有並使用它的速率。
例如,不斷增加的用戶群或 Tensor 活躍錢包數量的提升,通常代表著一個健康且持續擴展的網路。此外,其實際應用也扮演著重要角色。當這個加密資產在現實世界中越有實用性,其價值就越有可能被社群認可,儘管在短期內其仍可能因為行銷活動而獲得投機性價值。
除了 Tensor 的生態系統之外,更廣泛的市場趨勢與公眾認知也會影響其價值。金融市場的一般情緒以及與數位資產相關的新聞報導,可能會引發 Tensor 價格的波動。重大公告、重要媒體報導或社群媒體上的廣泛討論,都有可能提升其關注度,並影響人們對於 Tensor 未來前景的看法。此外,來自政府機構的監管發展也會影響整個數位資產領域,進而影響其價格表現。
全球 Tensor 價格
如何購買 Tensor

建立你的免費 Toobit 帳戶
使用你的電子郵件地址/手機號碼與居住國家在 Toobit 註冊,並建立強密碼來保護你的帳戶。

驗證你的身份
輸入你的個人資料並上傳有效的照片身份證件來驗證你的身份。
新增付款方式並購買 Tensor(TNSR)
在驗證您的 Toobit 帳戶後新增信用卡 / 金融卡或銀行帳戶。使用各種付款方式在 Toobit 上購買 Tensor。
交易 TNSR 永續合約
成功註冊 Toobit 並購買 USDT 或 TNSR 代幣後,您即可開始交易衍生品,包括 TNSR 合約與槓桿交易,以提升收益。
透過跟隨專業交易員參與 TNSR 跟單交易。
註冊 Toobit 並成功購買 USDT 或 TNSR 代幣後,您也可以開始跟單交易,關注專業交易員。
我可以在哪裡購買 Tensor?
在 Toobit app 上購買加密貨幣
幾分鐘內註冊完成,即可使用信用卡或銀行轉帳購買加密貨幣
在 Toobit 交易
將你的加密貨幣充值至 Toobit,享受高流動性與低交易手續費。
影片區 — 快速驗證,快速交易
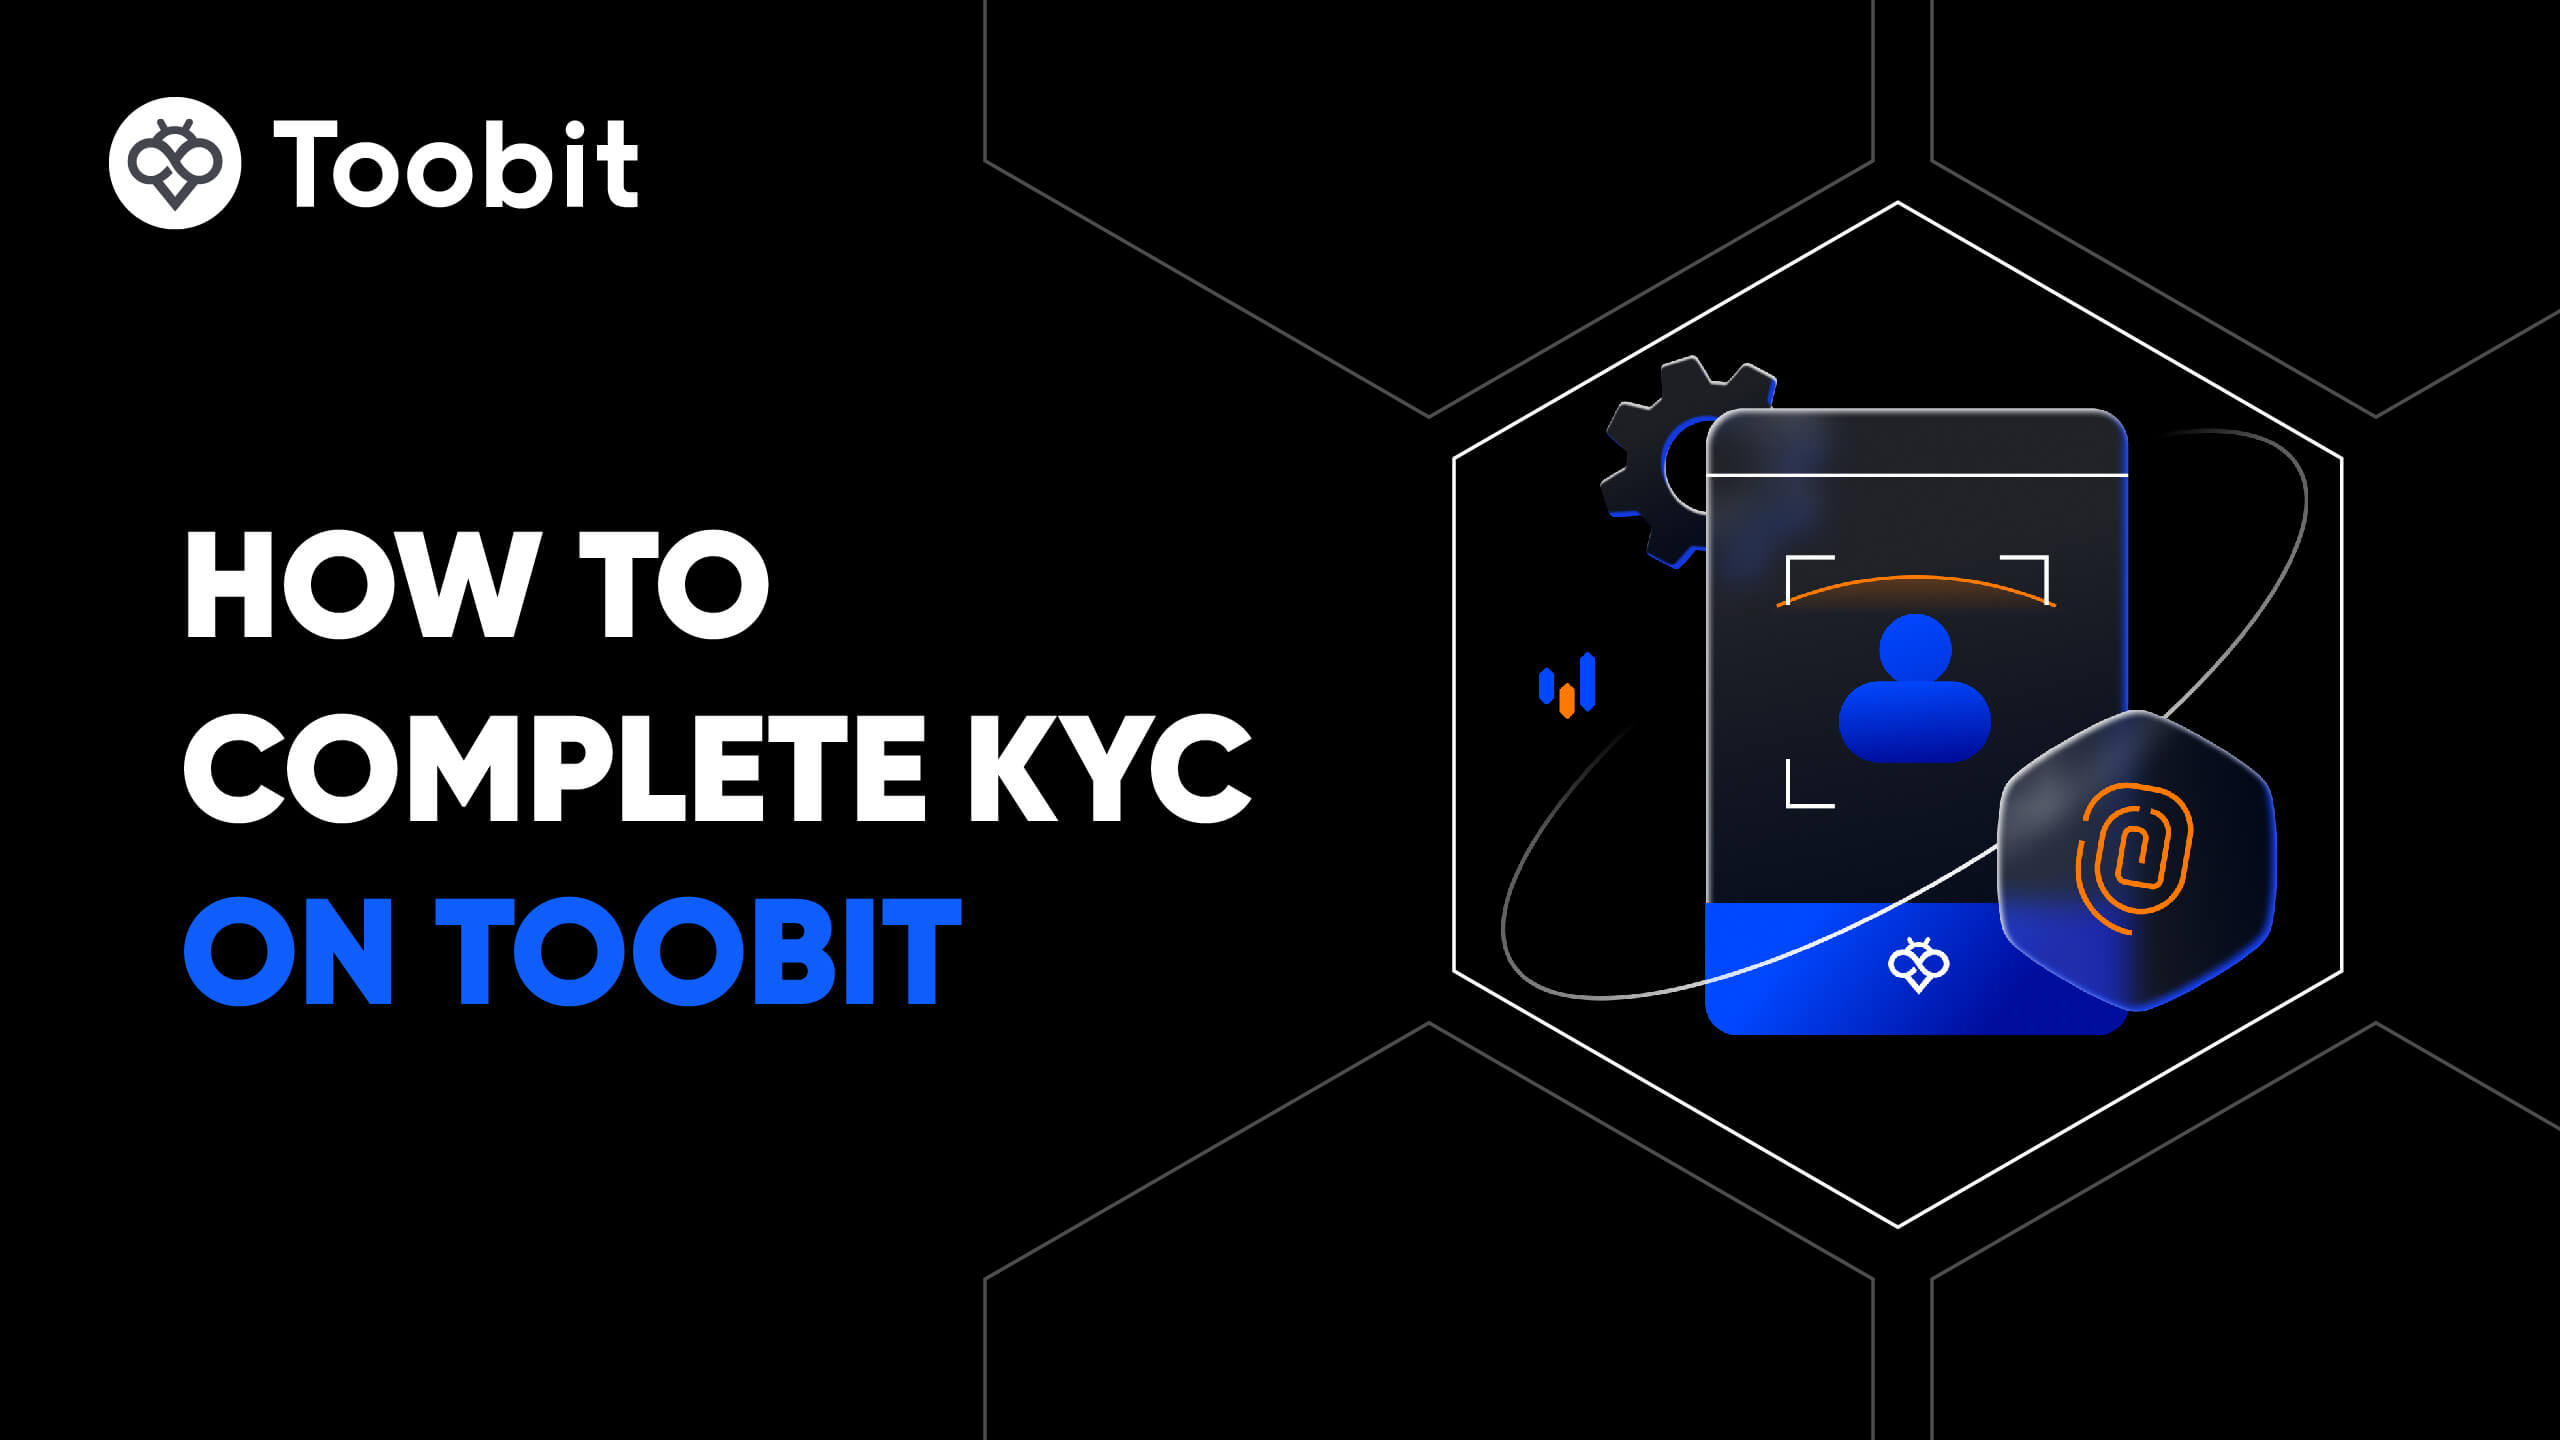
如何在 Toobit 完成身份驗證並防範詐騙
- 1.登入你的 Toobit 帳戶。
- 2.如果你是 Toobit 新用戶,請觀看我們的帳戶建立教學。
- 3.點擊導覽列右上角的個人圖示,然後點擊身份驗證頁面。
TNSR/USD 價格計算器
幣種排行
- Apps
- Google Play
- App Store
- Android APK
- 社群


© 2026 Toobit.com. All rights reserved.