交易行情Act I : The AI Prophecy

Act I : The AI Prophecy 價格

ACT
USD
--USD+0.00%1D
截至今日 --(UTC+0),Act I : The AI Prophecy (ACT) 在 undefined 的價格為 -- USD。
Act I : The AI Prophecy兌USD價格實時走勢圖(ACT/USD)

Act I : The AI Prophecy 市場資訊

價格表現(24小時)
24小時最低價 --
24小時最高價 --
歷史最高價
--
價格變化(24小時)
+0.00%
價格變化(7日)
--
市值排名
#-
市值
--
24小時成交量
--
流通供應量
948.25M
最大供應量
1.00B
總供應量
--
鏈接

Act I : The AI Prophecy 即時價格(今日 USD)

即時 Act I : The AI Prophecy 價格為 --,目前市值為 --。Act I : The AI Prophecy 價格在過去 24 小時上漲了 0.00%,24 小時交易量為 --。ACT/USD(ACT 對 USD)兌換率會即時更新。

1 個 ACT 現值多少 ?

目前,Act I : The AI Prophecy (ACT) 對 的價格為 --。你現在可以用 USD 購買 1 個 ACT。在過去 24 小時內,最高的 ACT 對 USD 價格為 --,最低的 ACT 對 USD 價格為 --。

關於 Act I : The AI Prophecy(ACT)

第一幕是少數幾個探索如何讓人工智慧超越冰冷潮濕的一對一用戶/助手模式,而是以平等網路的形式進行互動的項目之一。

Act I : The AI Prophecy 價格歷史

時間
價格變化
最低價格
最高價格
24h
+0.00%
--
--
0d
+0%
$0
$0
0d
+0%
$0
$0
0d
+0%
$0
$0

為什麼 Act I : The AI Prophecy 的價格總是波動?

哪些因素會影響 Act I : The AI Prophecy 價格的表現?

全球 Act I : The AI Prophecy 價格

目前 Act I : The AI Prophecy 在其他貨幣中的價值是多少?最後更新時間:--(UTC+0)。

如何購買 Act I : The AI Prophecy

建立你的免費 Toobit 帳戶

建立你的免費 Toobit 帳戶

使用你的電子郵件地址/手機號碼與居住國家在 Toobit 註冊,並建立強密碼來保護你的帳戶。
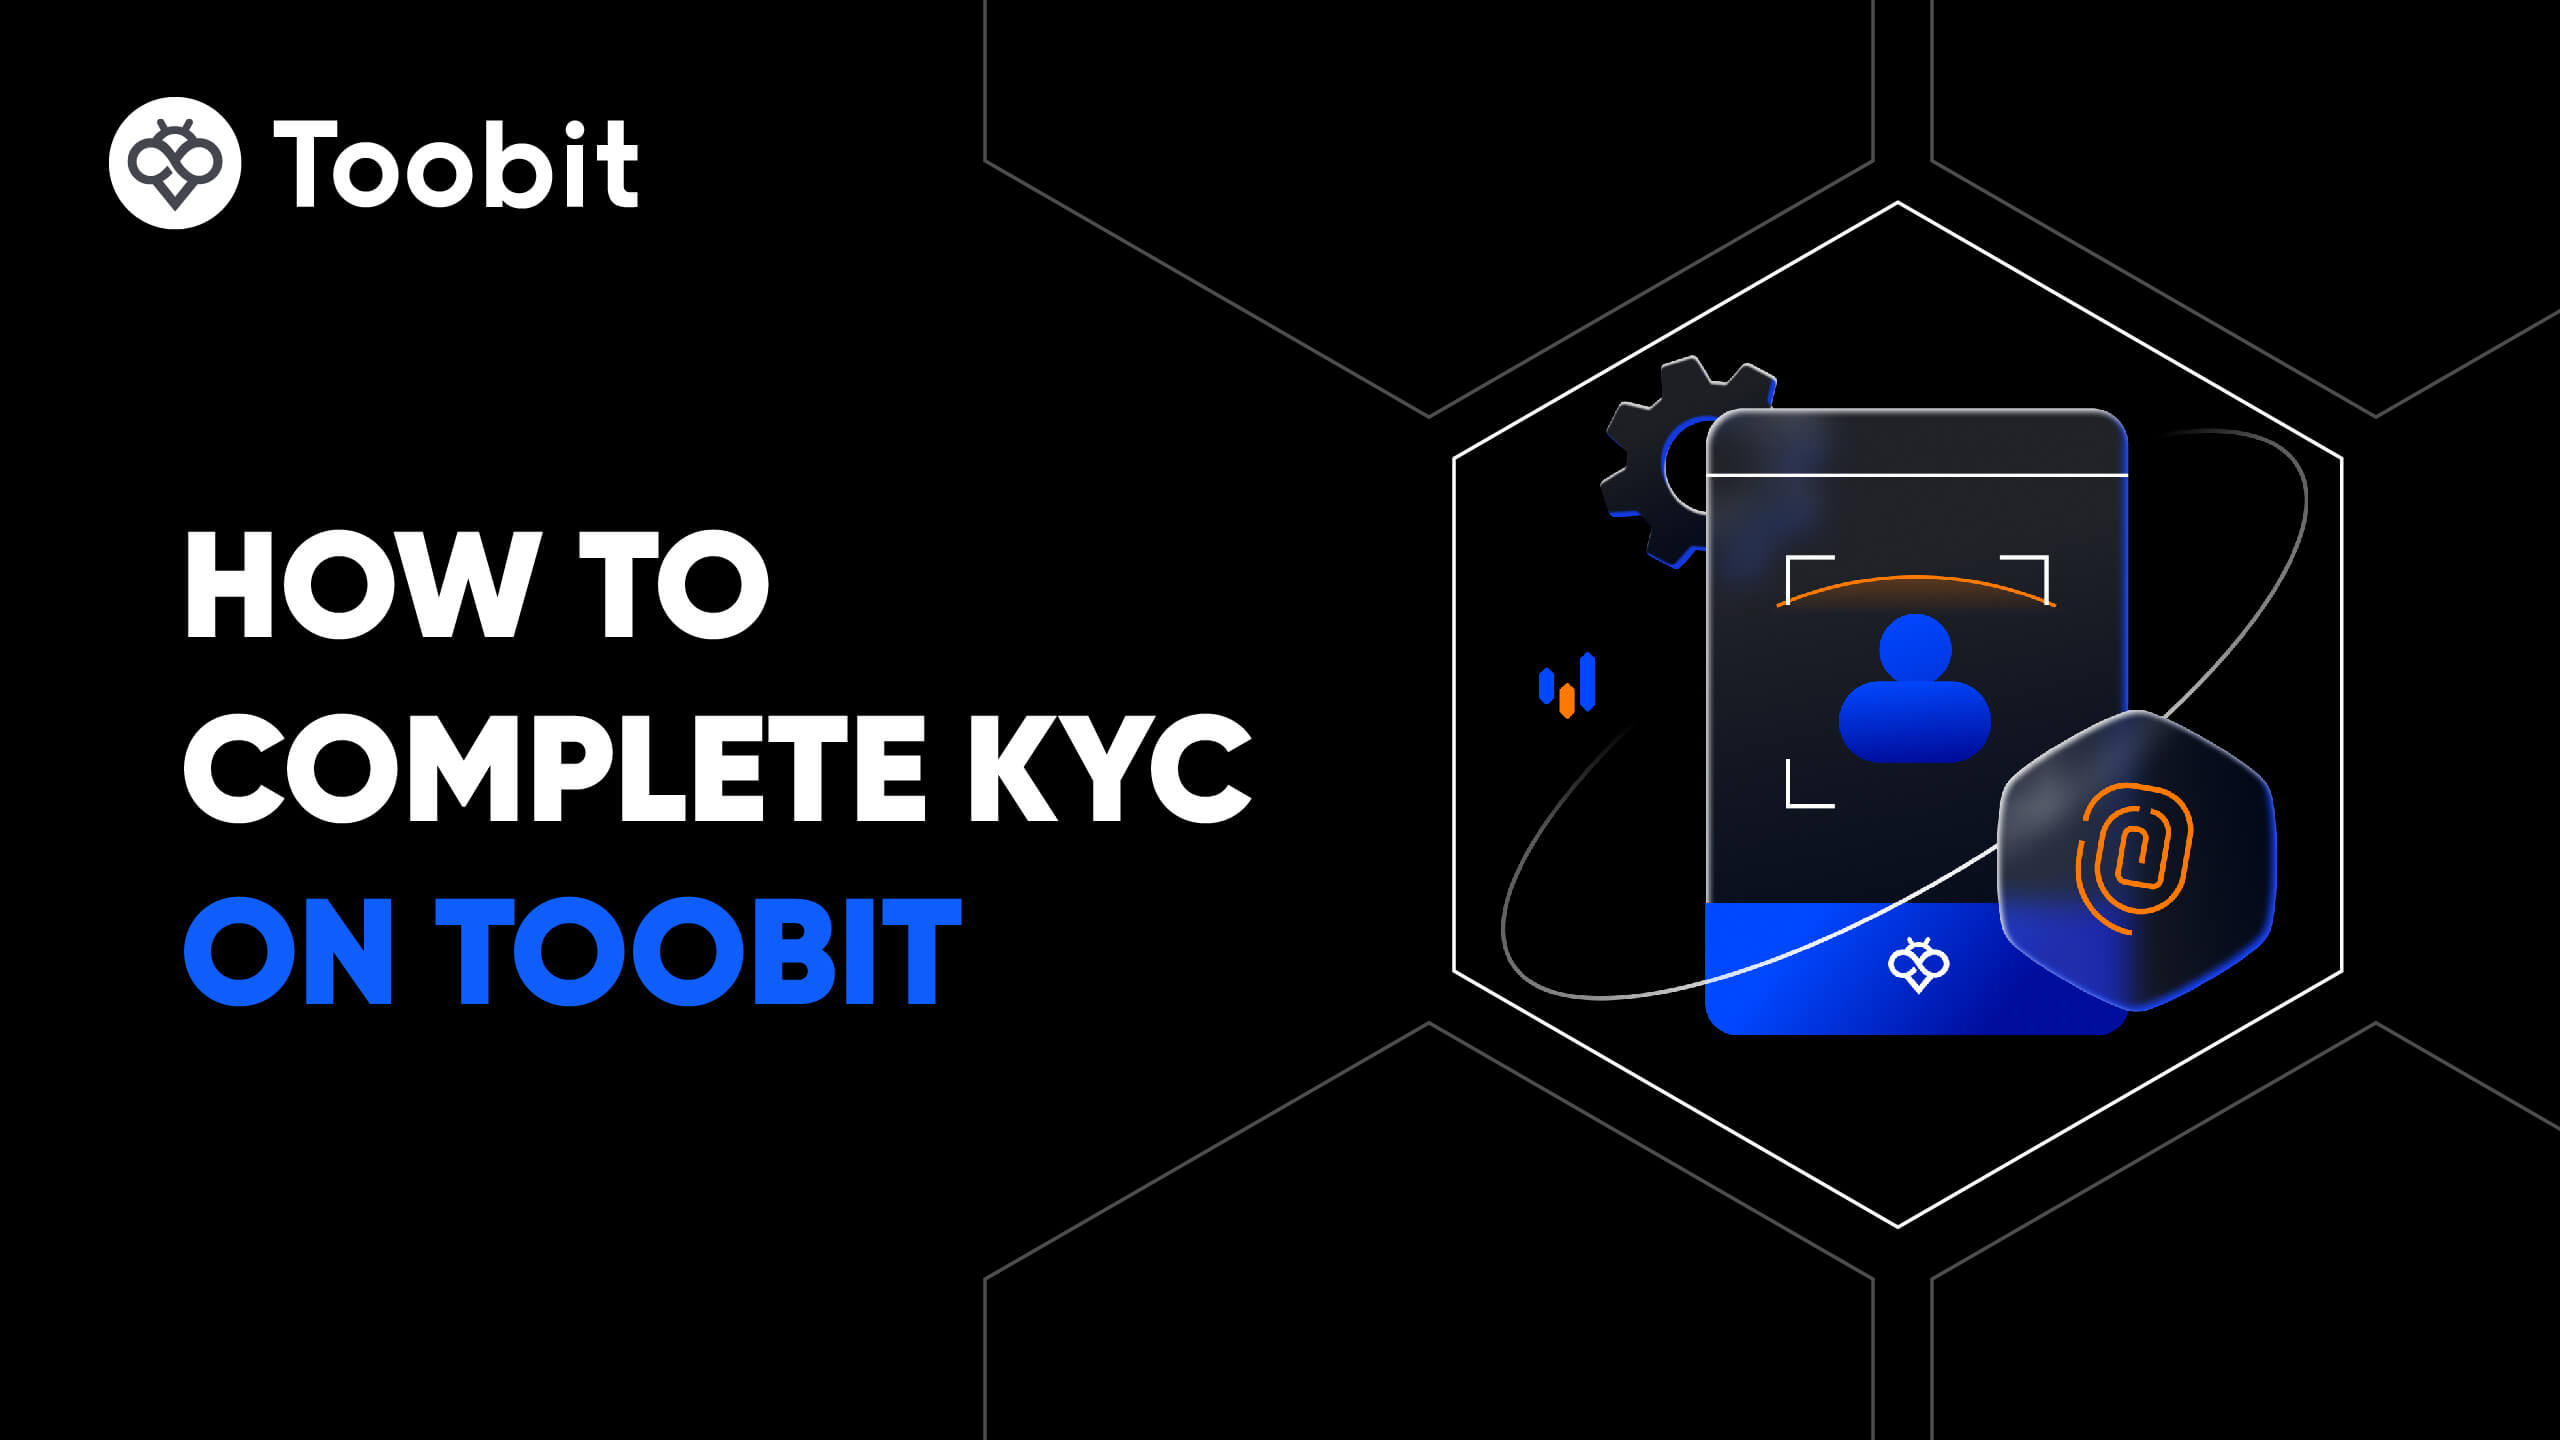
驗證你的身份

驗證你的身份

輸入你的個人資料並上傳有效的照片身份證件來驗證你的身份。

新增付款方式並購買 Act I : The AI Prophecy(ACT)

新增付款方式並購買 Act I : The AI Prophecy(ACT)

在驗證您的 Toobit 帳戶後新增信用卡 / 金融卡或銀行帳戶。使用各種付款方式在 Toobit 上購買 Act I : The AI Prophecy。

交易 ACT 永續合約

成功註冊 Toobit 並購買 USDT 或 ACT 代幣後,您即可開始交易衍生品,包括 ACT 合約與槓桿交易,以提升收益。

透過跟隨專業交易員參與 ACT 跟單交易。

註冊 Toobit 並成功購買 USDT 或 ACT 代幣後,您也可以開始跟單交易,關注專業交易員。

我可以在哪裡購買 Act I : The AI Prophecy?

在 Toobit 應用程式上購買加密貨幣

幾分鐘內註冊完成,即可使用信用卡或銀行轉帳購買加密貨幣

在 Toobit 交易

將你的加密貨幣充值至 Toobit,享受高流動性與低交易手續費。

FAQ About ACT

  • What Is Achain? (ACT)

    Achain is a blockchain-based platform designed to empower developers of all skill levels to issue tokens, create smart contracts, and build decentralized applications (dApps) and blockchain systems. By fostering a global blockchain network, Achain facilitates seamless information exchange and value transactions, contributing to the evolution of decentralized technology.
    Core Features of Achain
    Safety, Stability, and Scalability: Achain prioritizes these principles to create an ecosystem that promotes trust, collaboration, and peer-to-peer value exchange under shared social consensus.
    Delegated Proof-of-Stake (dPoS): The platform operates on this efficient and secure consensus mechanism to ensure smooth network operations.
    Smart Sandbox Mechanism: Achain employs a smart sandbox for pre-deployment contract testing. This process ensures that newly written contracts are automatically tested for vulnerabilities before being approved for deployment on the platform.
    Enhanced Smart Contracts: Achain redefines traditional smart contracts by enabling data interaction between blockchain systems and external networks, expanding their use cases beyond blockchain-native functions.
    Applications in Supply Chain Finance
    Achain extends its utility to supply chain finance, providing solutions for businesses to optimize payment terms and streamline credit systems. This functionality allows companies to extend payment terms to suppliers while enabling both large and SME suppliers to access early payments, enhancing the efficiency of financial transactions across the supply chain.
    ACT Token: Fueling the Ecosystem
    ACT, the native token of the Achain ecosystem, powers its services. Token holders gain access to essential blockchain features such as smart contract deployment, network partitioning, and more, ensuring seamless participation in the Achain network.
    Achain's Vision
    Guided by its whitepaper, Achain is dedicated to resolving key blockchain challenges while building a network that bridges trust, collaboration, and innovation. Its focus on security, scalability, and functionality makes it a standout platform for developers and enterprises alike.
  • How to buy ACT

    To buy ACT, you can follow these general steps:

    1. Choose a cryptocurrency exchange and Create an Account
    Start by selecting a reputable and reliable cryptocurrency platform that supports ACT trading. You can also buy ACT here on Toobit. Sign up.

    2. Complete Verification (Not Mandatory):
    Read our How to Complete Identification on Toobit guide for more information.

    3. Deposit Funds:
    Deposit funds into your Toobit account. This could be done via credit/debit cards, or your crypto wallet.

    4. Navigate to ACT:
    Once your account is funded, navigate to the Markets section of the platform.

    5. Buy ACT:
    Locate ACT in the list of available cryptocurrencies.
    Place a buy order. Read our How to Buy Crypto on Toobit guide for more information.
  • How to Sell ACT?

    You can sell ACT to USDT here on Toobit. Read our guide on How to Trade Spot on Toobit for more information.
  • What is ACT price Now?

    Are you looking for ACT Price? Live ACT price is updated in real-time on Toobit.
  • How to Withdraw ACT on Toobit?

    You can withdraw ACT and other crypto tokens into USDT here on Toobit. Read our How to Withdraw Crypto on Toobit guide for more information.
  • Achain Price Prediction Indicators

    Moving averages (MAs) are some of the most widely used tools for Achain (ACT) price predictions. These indicators help traders identify trends by smoothing out price fluctuations over specific time periods.
    For example, a 12-day Simple Moving Average (SMA) calculates the average of ACT’s closing prices over the past 12 days by summing them and dividing by 12. This provides a clearer picture of the overall trend by reducing the impact of short-term price volatility.
    In addition to the SMA, traders often utilize the Exponential Moving Average (EMA), which gives greater weight to recent prices. This makes the EMA more responsive to short-term price movements, offering valuable insights into market momentum.
    Key Moving Averages for ACT
    The 50-day, 100-day, and 200-day moving averages are among the most commonly used indicators in the cryptocurrency market. These averages help identify critical resistance and support levels:
    When the ACT price moves above one of these averages, it is often interpreted as a bullish signal, indicating upward momentum.
    Conversely, a price drop below these averages can signal weakness in the ACT market.
    Additional Indicators for ACT Forecasts
    Traders also complement moving averages with other popular tools such as:
    Relative Strength Index (RSI): Measures the momentum of price changes to identify overbought or oversold conditions.
    Fibonacci Retracement Levels: Help pinpoint potential support and resistance zones based on historical price movements.
    By combining these tools, traders can develop a more comprehensive strategy for predicting ACT price trends and making informed investment decisions.
  • How to read Achain charts and predict price movements?

    Candlestick charts are a popular tool among traders because they provide detailed insights into Achain (ACT) price movements compared to simple line charts. These charts allow traders to analyze price action at various granularities, such as:
    5-minute candlestick charts for short-term trades.
    1-hour, 4-hour, or 1-day charts for mid-term analysis.
    Weekly charts for identifying long-term trends.
    Understanding Candlestick Charts: Example of a 1-Hour Chart
    In a 1-hour candlestick chart, each ""candle"" represents ACT’s price action within a one-hour period. Each candlestick provides four key data points:
    Opening price: ACT’s price at the start of the hour.
    Closing price: ACT’s price at the end of the hour.
    Highest price: The peak price ACT reached during the hour.
    Lowest price: The lowest price ACT dropped to within the hour.
    Interpreting Candlestick Colors
    The color of the candlestick offers additional insights:
    Green candle: The closing price is higher than the opening price, indicating a bullish trend.
    Red candle: The closing price is lower than the opening price, signaling a bearish trend.
  • What affects the price of Achain?

    The price of Achain (ACT), like any other asset, is primarily driven by supply and demand dynamics. Several factors can significantly impact these forces, leading to price fluctuations in the market.
    Factors Driving ACT Price Action
    Fundamental Events:
    Block reward halvings
    Hard forks
    Protocol updates
    External Influences:
    Regulatory changes: Government policies and global regulatory developments.
    Adoption trends: Integration by companies, institutions, and governments.
    Security events: Cryptocurrency exchange hacks or breaches.
    These factors can trigger rapid changes in Achain's market capitalization, making it essential for traders to stay informed about the latest developments.
    The Role of ""Whales"" in the Achain Market
    When forecasting Achain price trends, monitoring the activity of ACT ""whales"" is crucial. Whales are entities or individuals holding significant amounts of ACT. In a relatively small market like Achain, their trades can exert a disproportionate influence on price movements, creating both risks and opportunities for other investors.
    For example:
    Whale buying activity: Often interpreted as a bullish sign, potentially driving the price upward.
    Whale selling activity: May signal bearish sentiment, leading to downward price pressure.
    Understanding Market Dynamics
    Staying aware of these drivers and monitoring whale activity can help traders make informed decisions when navigating the ACT market. Combining fundamental analysis with technical tools like moving averages or RSI indicators can provide a well-rounded strategy for predicting price movements and identifying trading opportunities.

ACT/USD 價格計算器

ACT
USD
1 ACT = -- USD。當前將 1 Act I : The AI Prophecy (ACT) 兌換為 undefined 的價格為 --。匯率僅供參考。剛剛更新。
Toobit 致力於提供相較於多數主流交易平台更低的交易手續費。您的 VIP 等級越高,享有的費率就越優惠。

幣種排行

暫無數據