Is Ethereum warming up for another run?
If you’re reading this in mid-January 2026, you made it through a rough stretch.
The late-2025 crypto slump, the post-exchange-traded fund (ETF) unwind that pushed many institutional players to the sidelines, and months of U.S. regulatory back-and-forth all took their toll.
Plenty of traders didn’t make it. Most meme-coin portfolios didn’t either, wiped out during December’s sharp sell-off.
Now the question on trading desks is straightforward: is Ethereum’s current price a bargain or a bull trap? As the year begins, it seems to be stuck in a holding pattern.
As 2026 kicks off, the big question isn’t whether Ethereum (ETH) still matters, it’s whether the price of ETH is setting up for its next defining move.
ETH is moving sideways, hinting at a recovery, while still weighed down by broader macro uncertainty.
What is Ethereum (ETH)?
Ethereum is a blockchain platform designed for more than just payments. It powers smart contracts, decentralized finance (DeFi), non-fungible tokens (NFTs), decentralized autonomous organizations (DAOs), and a growing list of on-chain applications.
ETH, the native token, is used to pay transaction fees, secure the network through staking, and act as collateral across the ecosystem.
To understand the ETH cryptocurrency price, it helps to stop viewing it as a short-term trade and start treating it as a maturing network.
By 2026, Ethereum’s role has changed. It is no longer mainly a hub for ICOs or early-stage DeFi experiments. It now functions as core infrastructure.
Ethereum’s Layer 1 acts as a global settlement layer. It is secure, limited, and costly by design. Layer 2 networks such as Arbitrum, Optimism, Base, and Linea rely on it to post data, paying fees through blobs introduced by recent upgrades. Users rarely interact with L1 directly, but it underpins everything built on top of it.
This shifts how Ethereum price prediction works. The focus is no longer on retail gas fees alone. It is about whether fee revenue from Layer 2 activity can exceed new ETH issuance, supporting scarcity over time.
ETH price history and performance overview
To understand current ETH price movement, it helps to look back. Ethereum’s path from the 2016 DAO hack to the 2022 Merge was shaped by internal splits and major technical shifts.
By 2024–2025, spot ETF approvals marked a turning point, bringing Ethereum into a more institutional phase.
Ethereum price charts from 2025 show sharp swings. Prices pushed to new highs, then pulled back as heavy leverage was unwound. It was a clear reminder that even as the market matures, volatility remains part of crypto.
Post-merge, ETH shifted from a proof-of-work (PoW) narrative to one focused on:
-
Reduced issuance
-
Staking yield
-
ETH as productive collateral
The last two years have been more grind than glory but historically, that’s how Ethereum tends to behave before larger trend shifts.
ETH price history
The price of Ethereum hit its all-time high (ATH) on 25 August, 2025, reaching $4,953.73.
Ethereum’s all-time low was around $0.4209 on October 20, 2015, shortly after launch. At the time, Ethereum had few users, little liquidity, and no real applications. ETH was still an experiment, not an asset. That low now highlights how early the network once was.
ETH's latest performance
In the past 24 hours, Ethereum traded within a relatively tight range between $3,080 and $3,180, up about 1%, as buyers stepped in on dips and volatility cooled across majors.
ETH’s market capitalization remains near $380 billion, with circulating supply just over 120 million ETH. That’s enough to keep it firmly in second place, even as newer networks compete for attention.
Recent Ethereum price charts still point to consolidation around the $3,100–$3,200 zone. The shift, though, is in behavior: pullbacks are shallower, and rebounds are sticking a little longer. That usually signals a market deciding whether it has enough momentum to push higher or whether it needs more time to grind sideways.
Current market snapshot (January 12, 2026, 11:18:20 UTC)
According to ETH price charts, ETH/USDT is trading at approximately $3,170.
Here’s what the market data tells us:
-
24h Change: +2.4%
-
24h High: ~$3,171
-
24h Low: ~$3,090
-
24h Volume (ETH): ~47,121 ETH
-
24h Trading volume (USDT): ~$147 million
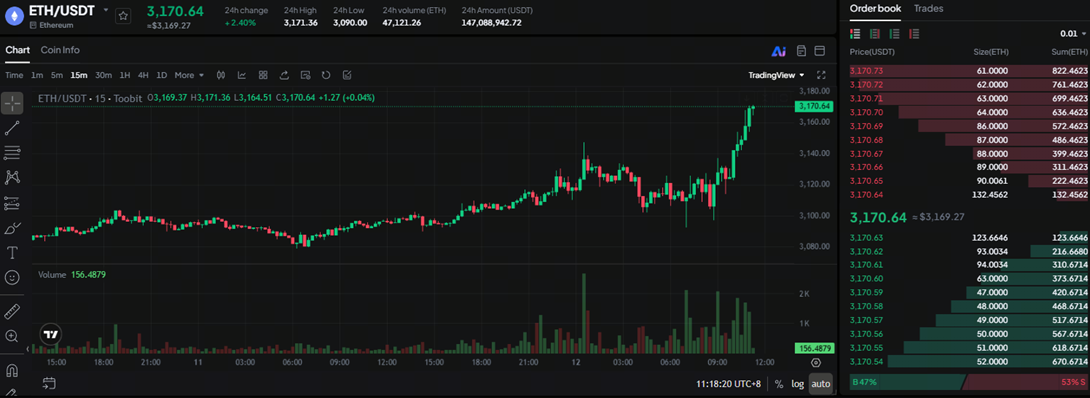
The Ethereum price movement over the past 24 hours shows steady upward pressure rather than a blow-off spike. Volume supports the move, suggesting this isn’t just a thin-liquidity bounce.
Bitcoin still leads the market, but ETH is being valued differently now. Many institutions see it less as a growth trade and more as a yield asset often described as an “internet bond.”
With staking yields holding around 3–4%, traders aren’t just betting on price moves; they’re earning income. That steady demand helped ETH hold the $3,000 level during the sell-offs in December.
On-chain and technical analysis
Support and resistance
Ethereum’s price structure is well-defined and easy to read right now. On the upside, $3,200 stands out as the main resistance. ETH has tested this level several times and stalled, suggesting there’s still supply waiting there. A clean break and hold above it would likely open the door to a push toward the mid-$3,300s.
On the downside, the $3,050–$3,100 zone has proven reliable. Each pullback into this range has attracted buyers, keeping the broader uptrend intact. As long as ETH holds above this band, the market is signaling accumulation rather than distribution. A loss of $3,050 would weaken that view and put $3,000 back in play.
Momentum indicators
Momentum indicators point to strength without excess. Relative Strength Index (RSI) on shorter timeframes is sitting in a healthy range, showing upward pressure but not the kind of stretched readings that usually precede sharp pullbacks. There’s no sign of bearish divergence yet, which supports the idea that buyers are still in control.
In simple terms, momentum favors continuation, not exhaustion. ETH isn’t racing ahead, it’s moving with intent.
Moving averages and volume
The Moving Average Convergence/Divergence (MACD) has flipped positive, pointing to short-term bullish control. ETH is also trading near its 200-day simple moving average, around the $3,147 area, a level many traders treat as a key line between trend support and breakdown.
Volume tells a similar story. Activity has increased on upswings and tapered during pullbacks. That’s typically what you want to see in a sustainable rally: buyers showing up with size, sellers stepping back when price dips.
On-chain cues
On-chain data adds weight to the technical picture. Exchange balances remain relatively stable, suggesting there’s no rush to sell into strength. At the same time, staking participation continues to limit liquid supply, reducing sell pressure during dips.
Transaction activity and Layer 2 usage also remain steady, reinforcing the view that Ethereum’s base layer is being used, not abandoned. From a market structure standpoint, this looks like building behavior, not the kind of frantic activity that marks a local top.
ETH price prediction and outlook
Ethereum’s outlook in 2026 is more grounded than speculative. ETH price movement is being driven less by hype and more by usage, yield, and regulation. As long as ETH/USDT holds above the $3,000 level, the broader structure remains intact. A clean break above $3,200–$3,300 would likely shift sentiment and bring momentum back.
Fundamentally, ETH price dynamics are tightening. Staking continues to lock up supply, while Layer 2 networks feed fees back to Ethereum’s base layer. This reduces liquid ETH without hurting demand, a setup that tends to support higher prices over time.
Institutional behavior also matters. ETH is increasingly treated as a yield-bearing asset rather than a pure risk trade. That shift has made drawdowns more orderly and less panic-driven.
In short, Ethereum price prediction in 2026 is less about chasing a breakout and more about whether Ethereum keeps its role as core financial infrastructure. If it does, the long-term outlook remains constructive.
This article is for informational purposes only and does not constitute financial advice. Always do your own research (DYOR) before making any decisions.
Key milestones for Ethereum
-
Ethereum launch (July 2015)
Ethereum went live, introducing smart contracts and programmable money.
-
Ethereum hard fork (July 2016)
The network forked to reverse the DAO hack, creating Ethereum and Ethereum Classic (ETC).
-
First major cycle peak (January 2018)
ETH reached its early all-time high during the ICO boom before the market reversed.
-
Beacon chain launch (December 2020)
Began Ethereum’s transition from PoW to proof-of-stake (PoS).
-
London upgrade: EIP-1559 (August 2021)
Introduced fee burning and changed ETH’s supply dynamics.
-
The Merge (September 2022)
Ethereum completed its move to PoS, cutting energy use by over 99%.
-
Shanghai / Shapella upgrade (April 2023)
Enabled ETH staking withdrawals, completing a major phase of the PoS transition.
-
Dencun upgrade (March 2024)
Introduced blob transactions, sharply reducing Layer 2 costs and boosting rollup adoption.
-
Spot ETH ETF approvals (May–July 2024)
Ethereum entered traditional finance markets, expanding institutional access and liquidity.
-
Layer 2 expansion (2025-2026)
Rollups like Arbitrum, Optimism, and Base became core to Ethereum’s scaling strategy, paying fees back to Layer 1.
Each milestone shifted ETH from a speculative asset toward something closer to yield-bearing infrastructure. That narrative hasn’t gone away, it’s just quieter now.
Community sentiment and ETH news
Ethereum is starting to look like a steady investment, and that shift matters. It is no longer a pure trading venue; it is infrastructure. The back-and-forth around the $3,147 level reflects a market adjusting to that change, not a loss of relevance.
Whether ETH moves toward a $5,000 base case or a $7,500 upside target will depend on adoption, usage, and regulation. The core question is how quickly markets accept that Ethereum now sits at the center of digital finance.
In addition, catalysts matter more than sentiment. The upcoming Glamsterdam upgrade is expected to improve Blob fee efficiency, with estimates that Blobs could account for 30–50% of total ETH burn over time. In parallel, the U.S. GENIUS Act is adding long-awaited regulatory clarity, which could support broader stablecoin use on Ethereum.
The bottom line
Ethereum enters 2026 in a familiar position: not flashy, not forgotten, but structurally sound. The ETH price near $3,147 reflects a market that’s reassessing value rather than chasing hype.
Whether ETH breaks higher or continues to range, the foundations look solid. And in crypto, boring fundamentals have a habit of turning exciting when least expected.
Sometimes the quiet charts are the ones worth watching.
How to start trading Ethereum
Ethereum’s more than just a coin, it’s an entire ecosystem. If you're ready to trade ETH like a pro (or at least fake it till you make it), Toobit makes trading altcoins easy. From Spot to Futures, we’ve got the whole toolkit.
