Crypto entered one of its most grueling periods this year, opening the month of June 2026 with a sobering reality check. Bitcoin (BTC) suffered a sharp drop of about 20% within a week, retesting the $60,000 critical support zone.
The move’s velocity reignited headlines, quickly declaring a full-scale Bitcoin crash. However, treating this as a death spiral oversimplifies a complex liquidity rotation.
On-chain metrics, order book data, and macroeconomic shift patterns paint a far more nuanced picture. This BTC decline is not a panic-driven capitulation of long-term conviction.
It is rather a combination of demand-side exhaustion and institutional rebalancing. Dissecting the 5 core drivers behind this BTC sell-off will provide a better understanding for this sudden correction.
Institutional de-risking
The 2024 to 2025 crypto bull run was built on institutional accumulation by U.S. Spot Bitcoin exchange-traded funds (ETFs). It was approved by the U.S. Securities and Exchange Commission (SEC) on January 10, 2024.
For nearly two years, these investment vehicles acted as a reliable liquidity sponge, consistently absorbing daily miner issuance and over-the-counter (OTC) whale distribution. In June 2026, however, that dependable engine completely flipped into reverse.
A wave of aggressive BTC ETF outflows marked a brutal 11-day consecutive streak of net negative redemptions. Institutional capital managers pulled an estimated $3.45 billion from the market in a matter of days.
This institutional retreat caused a negative feedback loop:
-
ETF inflows froze
-
Redemptions required Spot sales
-
Coinbase Bitcoin Premium Index going lower
-
Retail panic
The Coinbase Bitcoin Premium Index tracks price spreads between Bitcoin on Coinbase Pro and major centralized exchanges. It went deeper into negative territory as institutions sold spot supply to fulfill redemptions.
This confirmed that institutional buy orders that once protected the market’s downside had completely dried up. Without active wall-of-money inflows to absorb standard profit-taking, the order books became thin.
It paved the way for a swift BTC price drop on minimal volume.
MicroStrategy sentiment scare
While the baseline liquidity was already dwindling due to ETF redemptions, an unlikely psychological blow accelerated the crypto market decline.
MicroStrategy’s (MSTR) corporate treasury framework is widely regarded as the ultimate institutional HODLer. For years, MSTR's treasury represented a permanent BTC supply scarcity that would never hit the open market.
A regulatory filing however revealed that MicroStrategy had executed its first-ever BTC sale. It liquidated about 32 BTC between May 26 and 31, 2026 worth roughly $2.5 million, to cover operational obligations.
Quantitatively, this represented a minuscule 0.004% out of its 843,706 BTC aggregate holdings. It had almost zero impact on spot order book depth.

From @saylor X account
MicroStrategy actually went right back to accumulating BTC between June 1 and June 7, 2026. It purchased 1,550 BTC for $101.3 million, growing its treasury to 845,256 BTC.
However, it had a disruptive impact on crypto’s market sentiment due to a shattered promise by MicroStrategy’s founder Michael Saylor. His long-standing pledge to never sell a single satoshi has finally come to an end.
This shift in corporate posture was interpreted as a warning sign by traders. It created a wave of preemptive selling on fears that institutions might be preparing against a broader macroeconomic downturn.
Shared liquidity strain
Capital theoretically flows toward the path of highest efficiency and cleanest growth. On this end, BTC is actively losing the battle for risk-on capital to traditional technology equities for most of 2026.
Artificial intelligence (AI) and semiconductor stocks have completely monopolized Wall Street’s core risk appetite. It is driven by blockbuster corporate earnings and massive stock buyback programs.
These plays have acted as a massive liquidity sponge, starving crypto of the speculative capital needed to sustain all-time highs.
However, the June correction has exposed something between these two high-beta environments. Rather than a clean capital rotation out of digital assets, both sectors were recently hit by the exact same liquidity shock.
The 3.81% Consumer Price Index report last May 12, 2026 forced a hawkish tone from the Federal Reserve. This resulted in a multi-asset sell-off, wiping out roughly $1.3 trillion from the AI chip sector in June 2026.
This parallel downturn highlights the true nature of the June demand dip being a cross-asset margin squeeze. Top-heavy tech portfolios do not buy the crypto dip when institutional asset managers face heavy volatility and capital calls.
Instead, they aggressively liquidate non-core assets like BTC to protect their primary balance.
Geopolitical crises and macro events
Crypto cannot be decoupled from broader macroeconomic and geopolitical realities. Escalations in the U.S.-Iran geopolitical conflict in late May injected macro uncertainty into global markets.
These tensions resulted in disruptions to trade corridors and energy supply lines, causing crude oil prices to spike. Such energy shocks complicated an already rickety inflation outlook.
It kept consumer and producer price indices sticky and well above the Federal Reserve’s long-term targets. Consequently, the Federal Reserve adjusted its tone.
Any lingering market expectations for aggressive interest rate cuts in the second half of 2026 were thoroughly dashed. Central bank officials maintained an already hawkish stance, floating the necessity of keeping rates higher for longer.
This macro environment catalyzed a structural risk-off sentiment across global trading desks.
-
Yield preservation: Safe-haven capital fled to short-term U.S. Treasuries and cash equivalents. It now offers highly attractive, virtually risk-free nominal yields.
-
Asset liquidation: Highly speculative, non-yielding risk assets were the first to be pared back on institutional balance sheets. Cryptocurrencies were at the very top of the list.
Automated crypto liquidations
The gradual demand-driven slide in the spot market ultimately transformed into a cascade-style sell-off. This was due to the structural mechanics of the crypto derivatives market.
As the spot price drifted downward through late May, retail and institutional perpetual futures traders continuously attempted to catch the bottom. They opened heavily leveraged long positions causing derivatives Open Interest (OI) to bloat abnormally relative to spot volume.
It created a highly unstable, top-heavy market structure.
When spot price finally broke below major technical moving averages early June, it sparked an automated margin-call avalanche:
-
Spot price drops
-
Margin thresholds hit
-
Automated futures liquidations
-
Market orders sell spot
-
Next support fails
Over $1.5 billion in leveraged long positions were forcefully wiped out within a single 24-hour window. In a derivatives liquidation event of this scale, exchanges automatically execute market orders to close out bankrupt positions.
It aggressively dumps spot and futures supply into an already thin order book. Stop-losses are hunted which liquidates sub-clusters of traders and compounds the BTC price drop.
This mechanical selling forced prices into a vertical downward spike.
June 2026 market metrics
Observe these four on-chain and derivatives metrics to see how the market shifted over the first week of June 2026:
Bitcoin market cap
Fell from its peak of $1.48 trillion on June 1 down to $1.188 trillion on June 6. This contraction means that roughly $292 billion in actual capital exited the network during the drop.
Derivatives open interest
Shifted from an incredibly high-leverage bloat to a completely cleaned and normalized state. The resulting sell-off thoroughly wiped out over-leveraged long positions, successfully resetting funding rates back to a healthy baseline.
Coinbase Premium Index (June 1 to 9)
Remained entirely negative throughout the entire correction, tracking between -0.0191% and -0.2133%. The discount widened from -0.116% on June 1, 2026 to -0.22% on June 2, 2026.
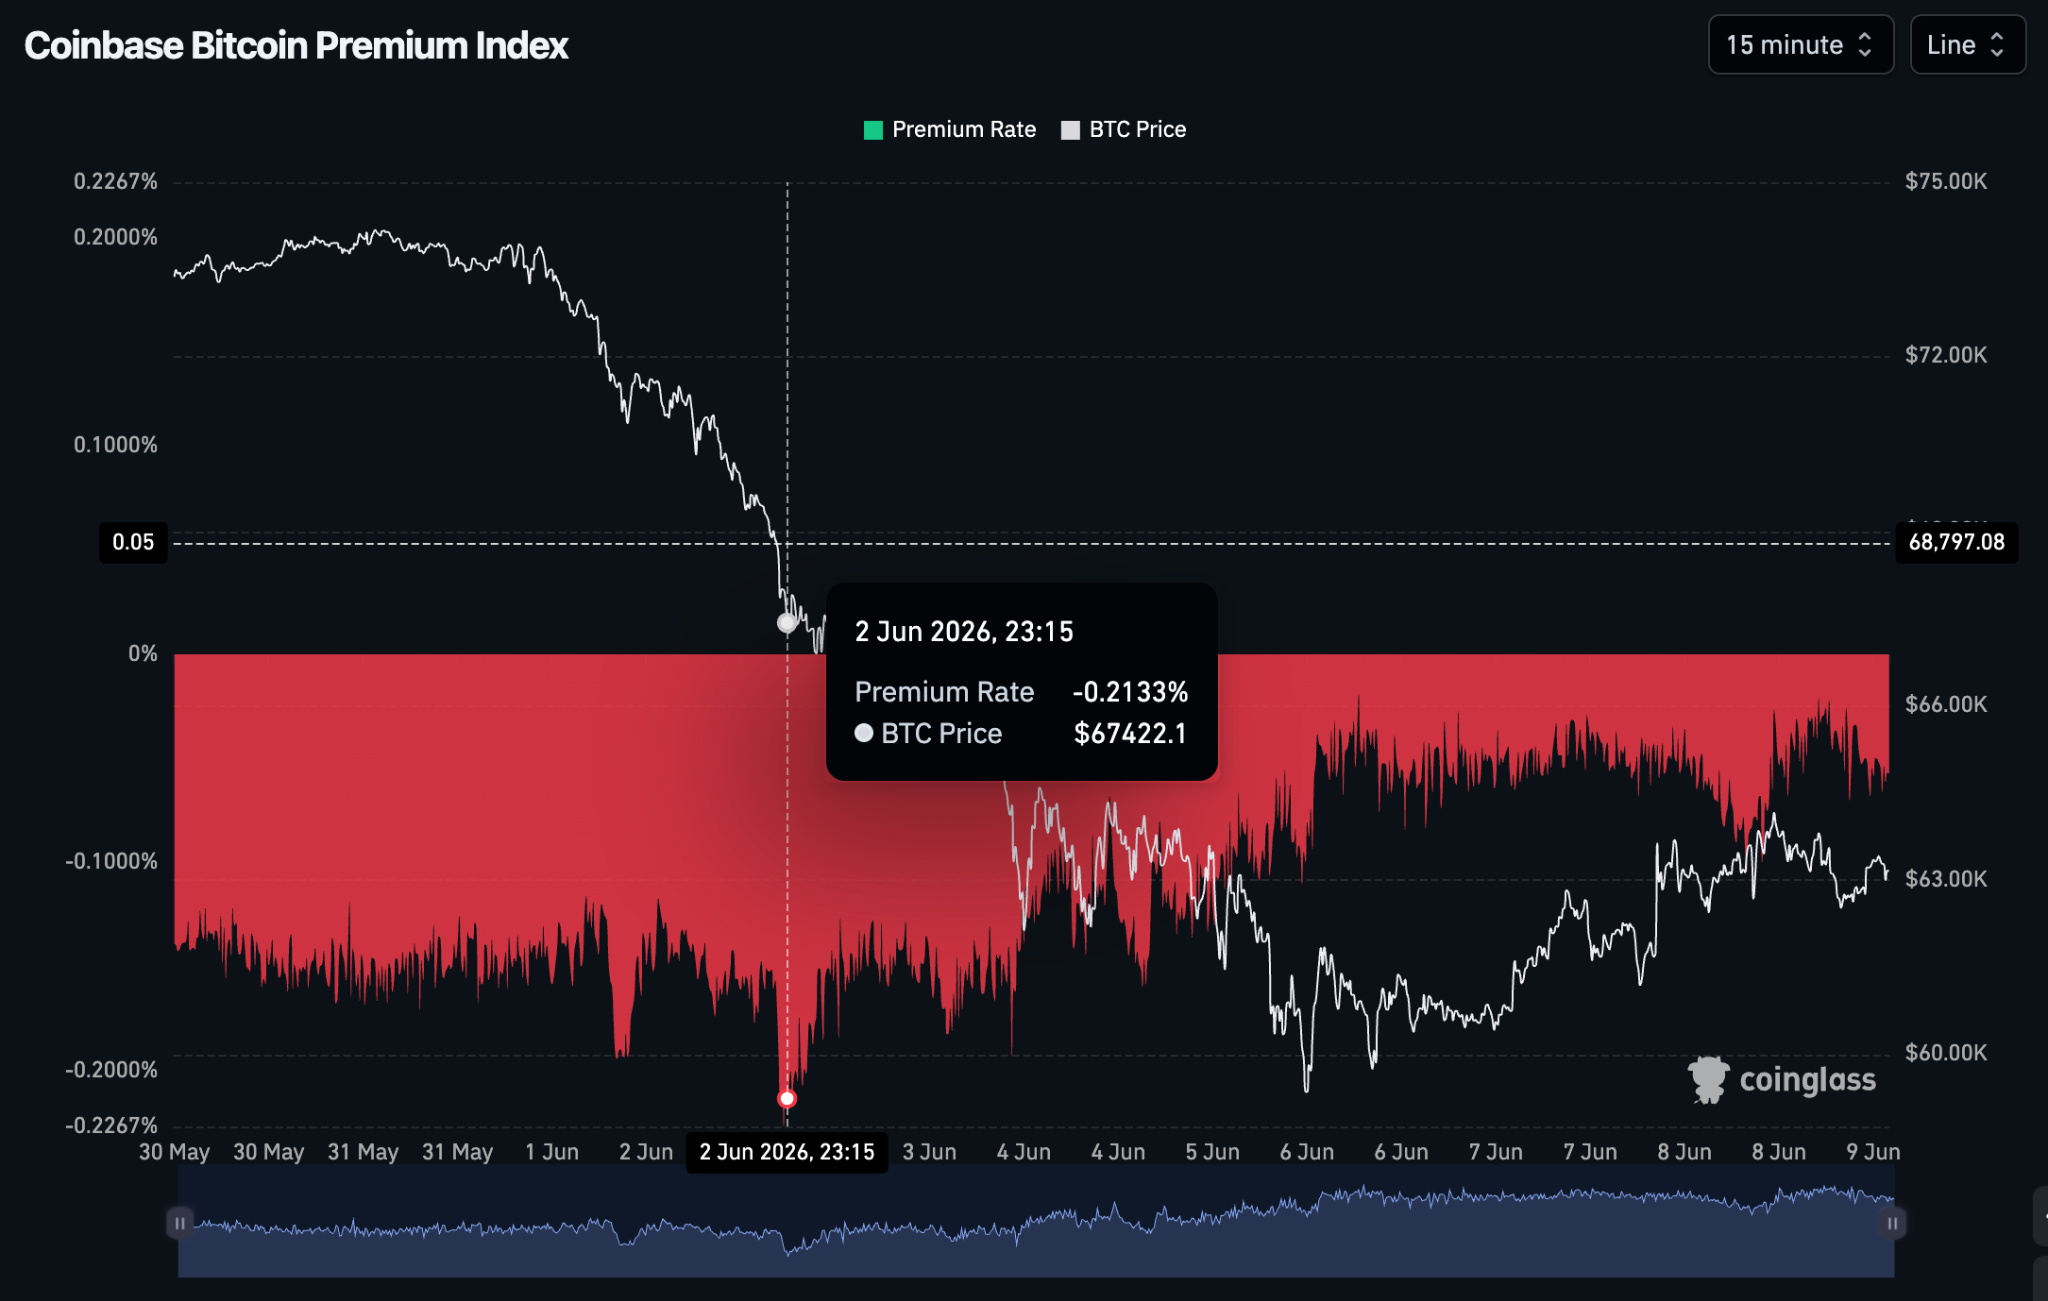
Coinbase Premium Bitcoin Index from CoinGlass
It showed that heavy US institutional spot selling contributed to the initial price collapse. However, as the price capitulated to $60,000 between June 4 to 6, the premium rapidly recovered toward -0.0191%.
This indicates that institutional selling dried up and buyers began absorbing the dip at the macro floor.
Daily BTC ETF flow average
Swung from a healthy +$250 million net inflow to a staggering -$313 million net outflow. This reversal fundamentally altered the market structure, turning a period of passive accumulation into one of structural distribution.
Mining rigs and realized cost hard floors
Despite the severity of the drop, this correction resembles a structural rebalancing rather than late 2022’s systemic collapse.
The primary line of defense for Bitcoin during deep macroeconomic drawdowns has historically been its underlying production cost. Following post-halving adjustments, the aggregate cost of production for mining operations sits in the $58,000 to $60,000 range.
As the price approached the $61,000 level in early June, numerous older-generation mining rigs hit their theoretical shutdown levels. It prompted an immediate minor capitulation of inefficient miners.
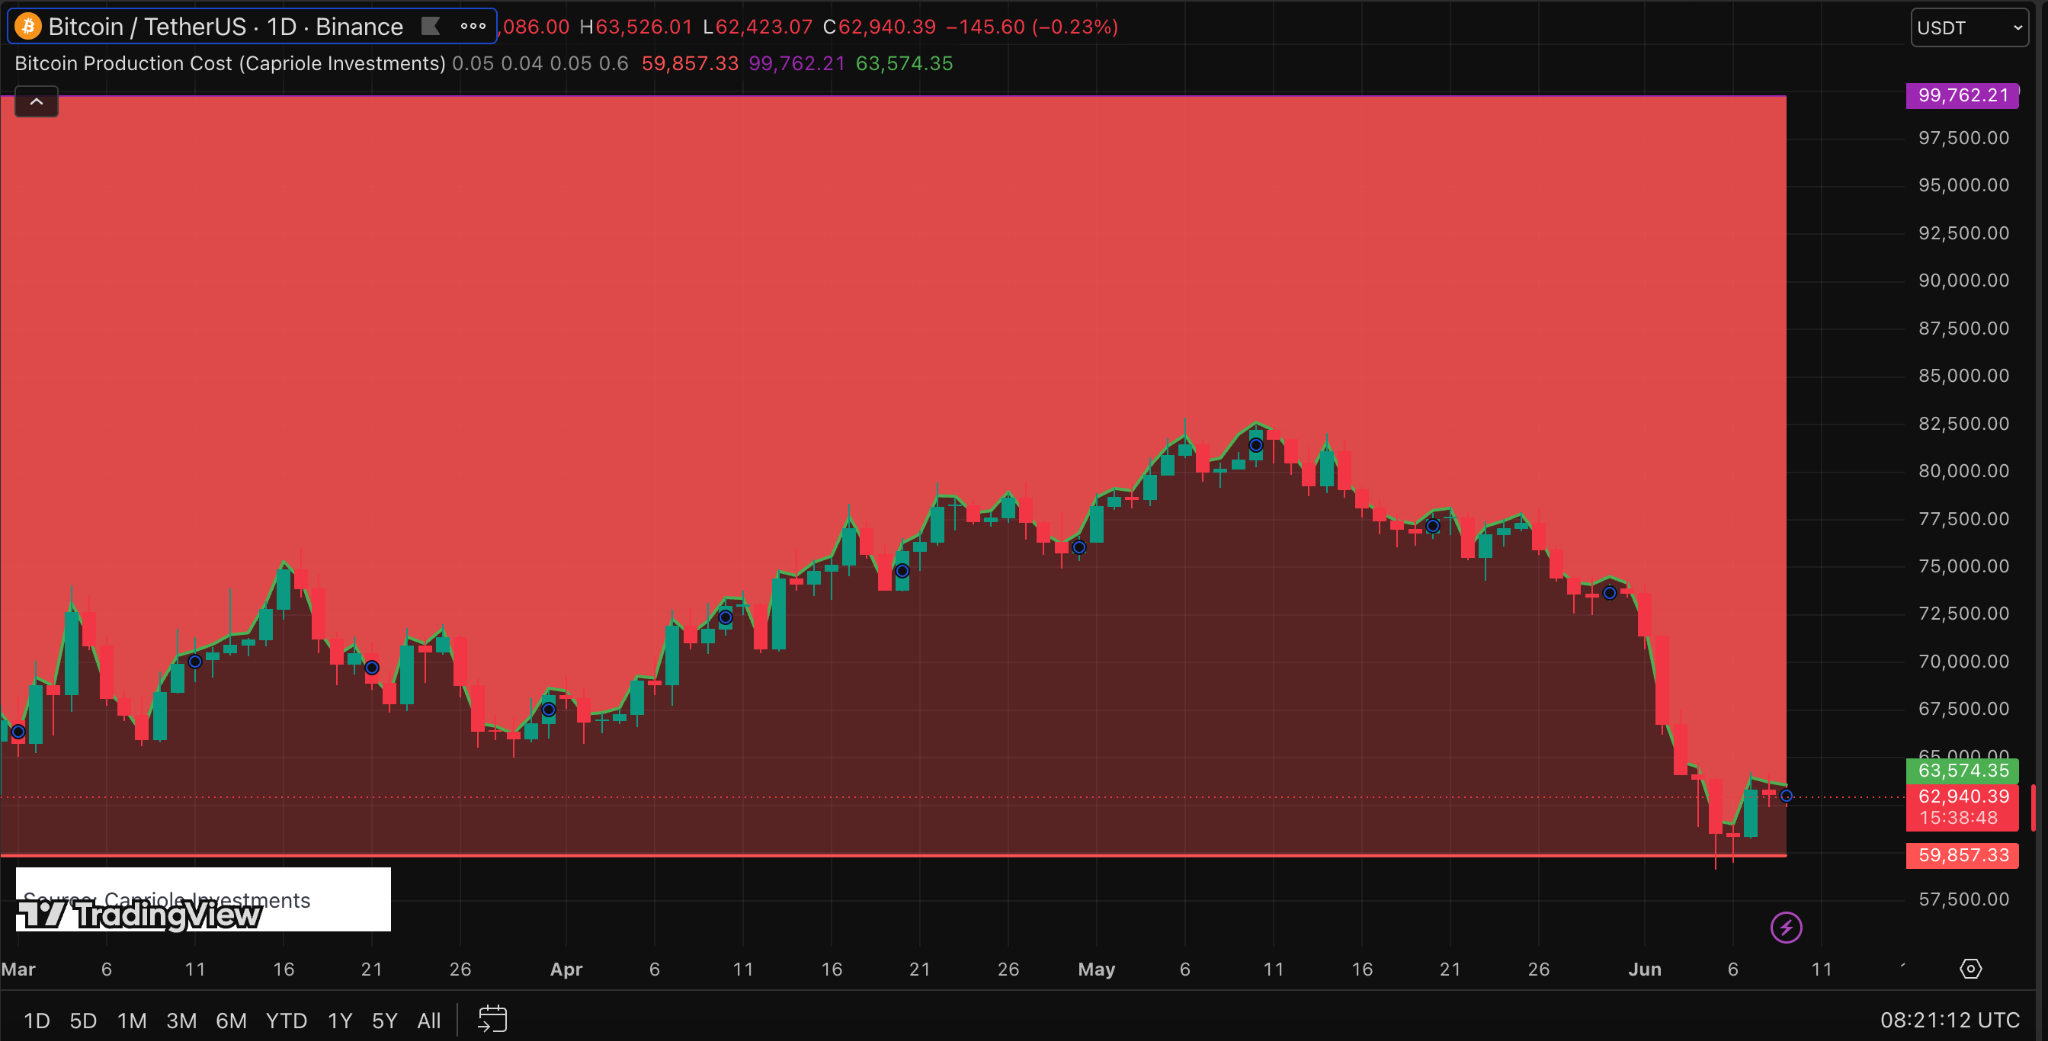
Bitcoin Production Cost indicator by Capriole Investments from TradingView
When market prices compress directly into the cost of production, it signals an impending macro floor. Miners stop selling assets below cost and buyers realize that the asset is trading at or near its physical baseline value.
Furthermore, the 14-day Relative Strength Index (RSI) and crypto market sentiment tracking indices have plunged directly into extreme oversold and panic territory. It reached its lowest on June 6, 2026 at 15.47 RSI on 31.61 RSI-based Moving Average.
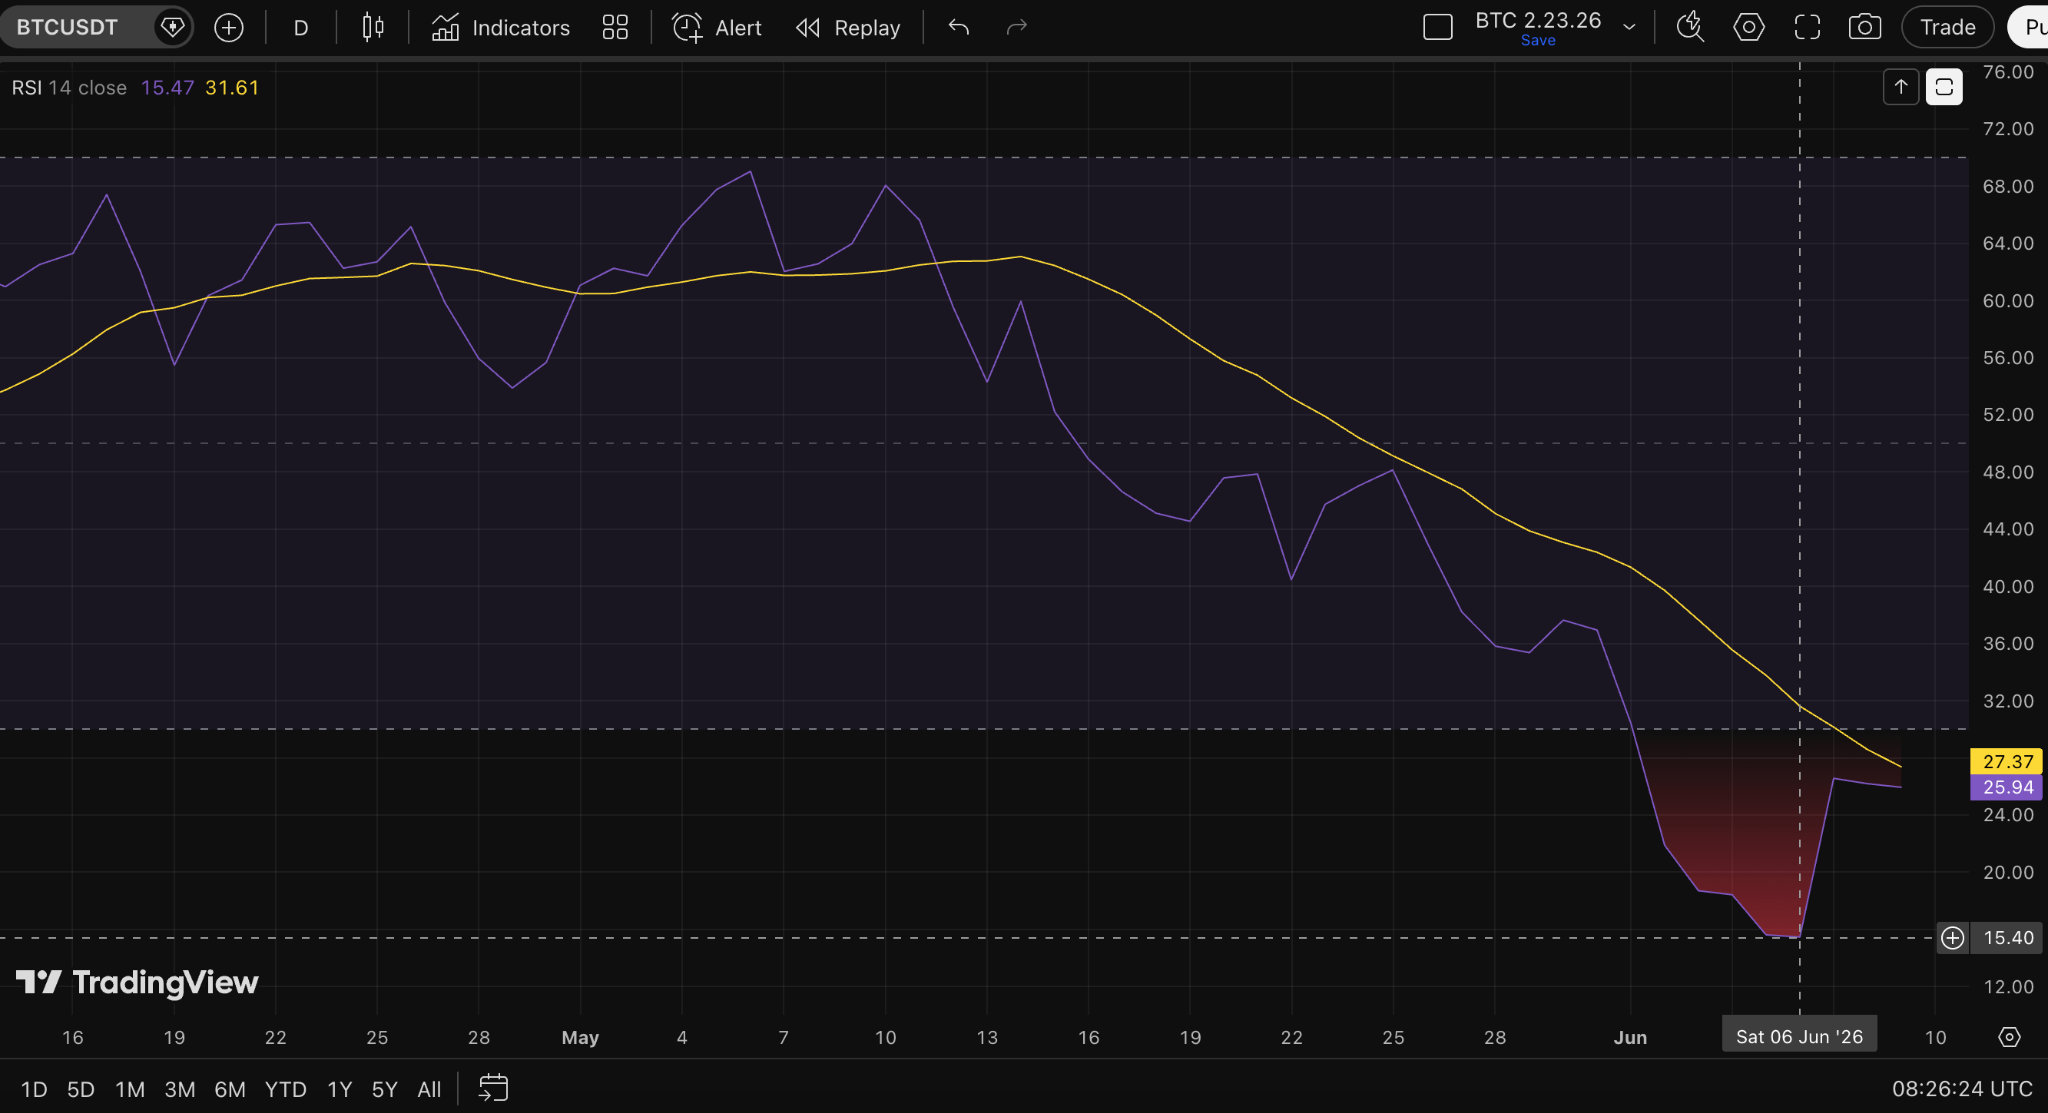
BTC to USDT 1 day RSI chart on June 09, 2026, 08:26 UTC+0 from TradingView
The Crypto Fear and Greed Index currently has a 10 (Extreme Fear) rating for June 9, 2026. Bitcoin and other large cryptocurrencies had an 8 (Extreme Fear) a day before.
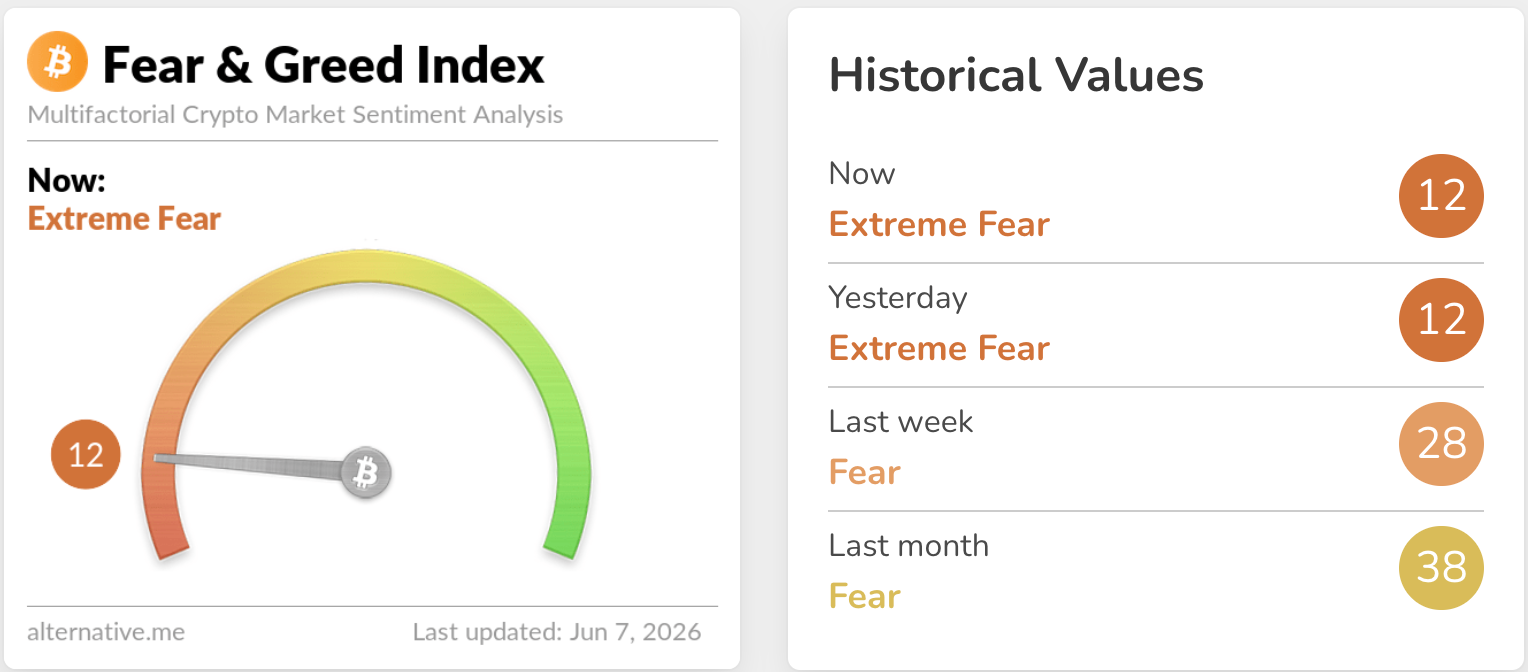
Crypto Fear and Greed Index on June 09, 2026 from Alternative.me
Taken together, these indicate that a potential short-term floor has been reached. There is a buying opportunity at these levels though further downside in the months ahead are still possible.
Long-term holders keeping supply illiquid during extreme fear consistently signals the final stages of a local bottom.
Bitcoin outlook for recovery
BTC’s outlook for the remainder of 2026 remains anchored by institutional infrastructure, even if the short-term trend demands extreme caution. It is only a matter of time before BTC loses its psychological $60,000 support zone later on.
Unlike previous cyclical bear markets, exchange-held balances of Bitcoin sit at extreme lows. This means that the physical floating supply available to be dumped on the market is fundamentally limited.
The primary issue plaguing June 2026 is not an overwhelming abundance of structural sellers. It is a temporary disappearance of buyers.
For a sustained Bitcoin recovery to take shape and reverse the current macro decline, three critical developments must materialize:
-
Stabilization of ETF inflows: The aggressive Bitcoin ETF outflows must flatten out and return to consistent, net-positive inflows. This will prove that institutions have completed their portfolio rebalancing.
-
Easing of AI capital competition: The capital concentration in traditional technology equities must cool down. It would allow opportunistic risk-on liquidity to rotate back into crypto.
-
Macro stabilization: Geopolitical tensions in the Middle East must show signs of deceleration, allowing energy markets to cool. This in turn gives the Federal Reserve the latitude to transition away from its current hawkish posture.
The broader consensus view from firms like J.P. Morgan, and Citigroup still maintain a macro year-end target ranging firmly between $100,000 and $150,000. Further downside after the immediate relief rally however is expected before reaching these levels.
This article is for informational purposes only and does not constitute financial advice. Always do your own research (DYOR) before making any decisions.
