
Crypto charts move fast. When you are switching between spot pairs, futures contracts, timeframes, and different trading styles in a single session, the screen can quickly become harder to read than the market itself. On Toobit, the TradingView chart suite is designed to reduce that friction, giving traders a more structured way to analyze price action without leaving the trading flow.
Good charting does not replace decision-making. It supports it. The value of TradingView inside Toobit is not more indicators or more tools. It is a clearer way to organize what the market is already showing you.
What changed on Toobit
Toobit has integrated TradingView directly into its trading interface, allowing users to switch between standard charts and TradingView mode depending on how deep their analysis needs to be.
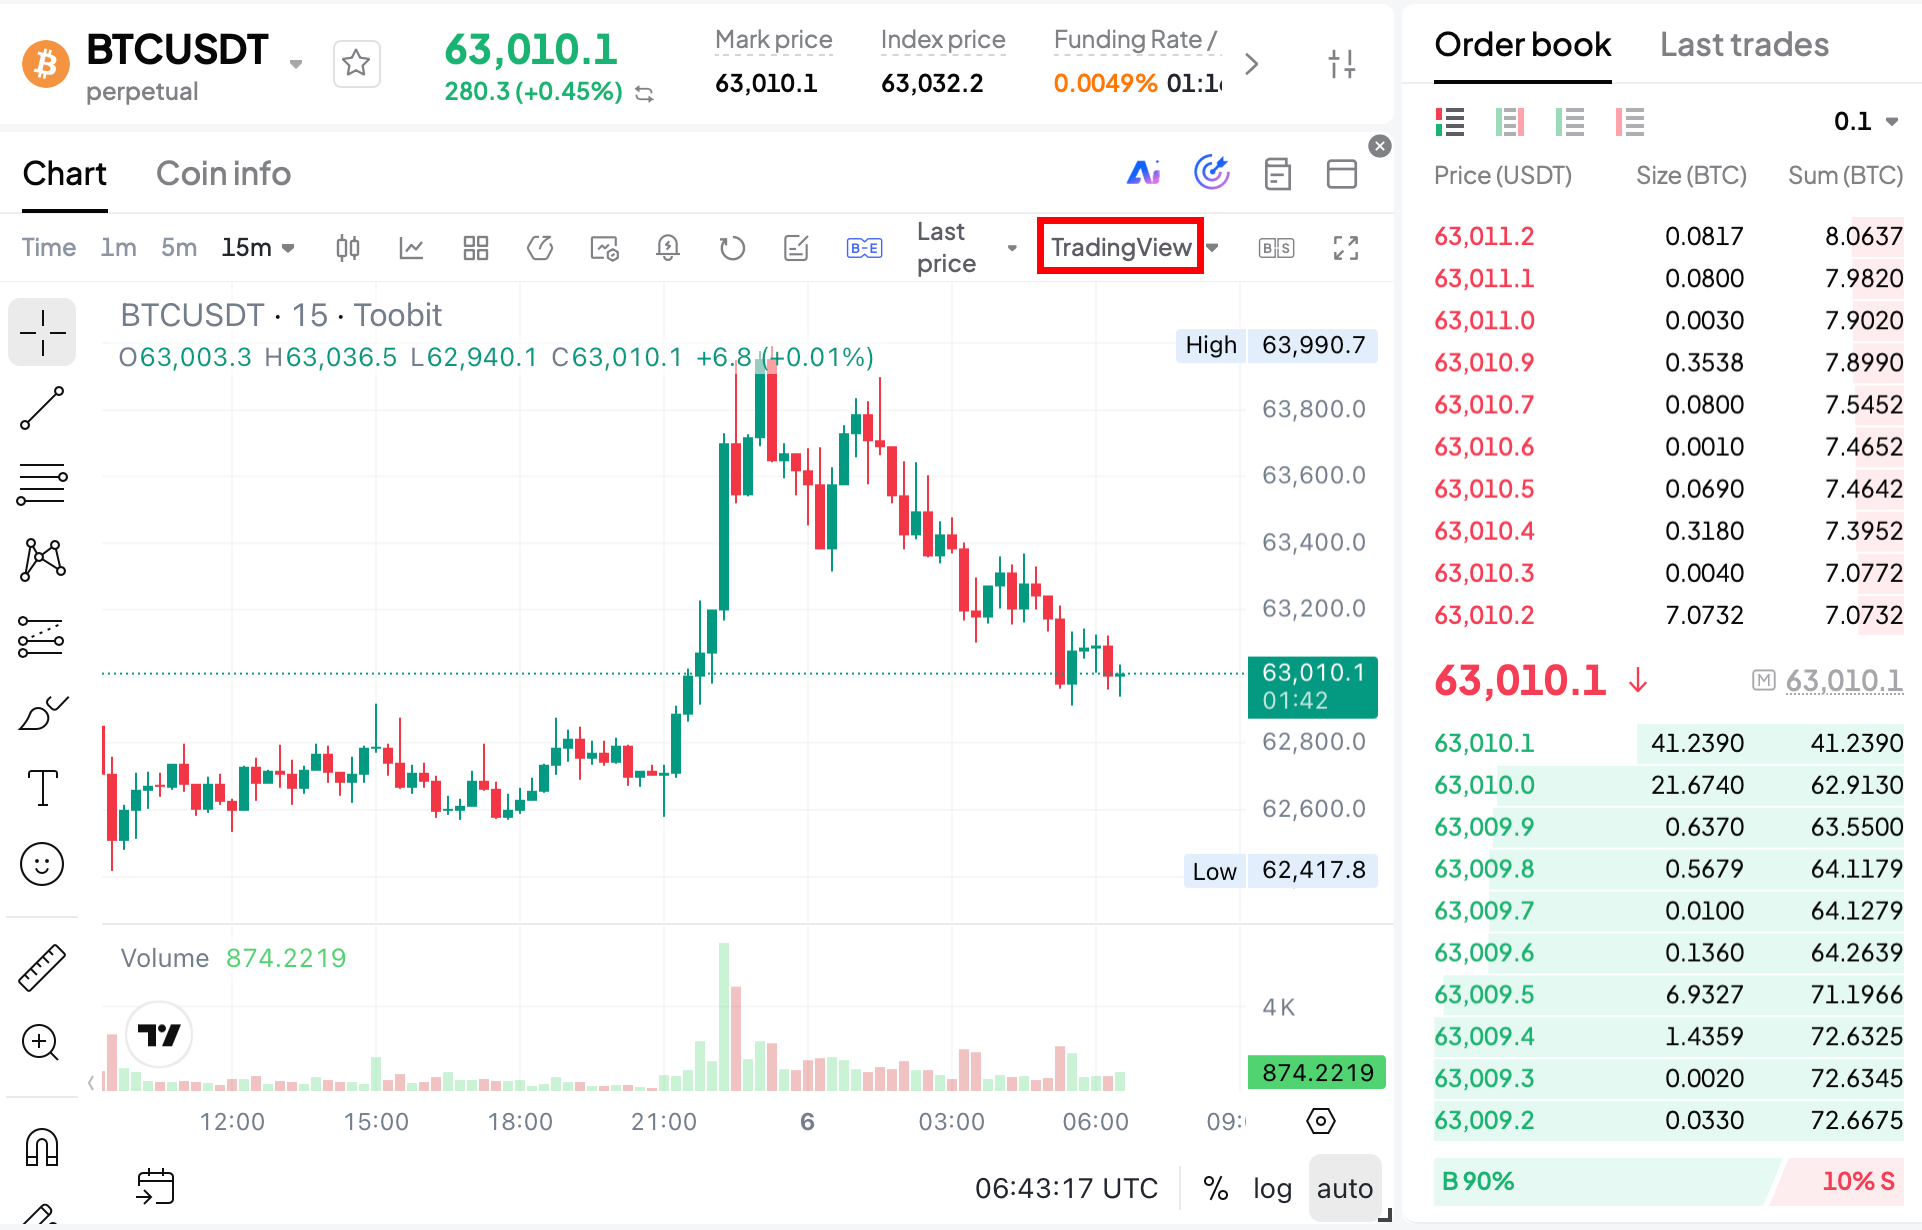
Not every trade setup requires the same level of detail. A quick check of price action may be enough in some cases. In others, especially during breakouts, pullbacks, or key level tests, traders may need indicators, drawing tools, and a wider view of market structure before they act.
The design choice here is flexibility. Traders are not locked into one chart style. They can switch modes from any supported spot or futures pair, and the system remembers their preference for future sessions, reducing repeated setup steps and keeping focus on analysis rather than configuration.
Why TradingView charts matter for traders
TradingView is widely used because it turns price movement into a structured workspace instead of a constant stream of candles. It allows traders to move between timeframes, map trend structure, and apply tools like trend lines and Fibonacci levels in a way that connects short term movement with broader market direction.
This matters because most trading decisions are not based on a single candle. They are based on context. TradingView helps make that context visible.
Its scale also reflects how common this workflow has become. TradingView brings together over 100 million traders and investors, showing how technical charting has moved from a specialist tool to a standard part of modern trading.
Usage patterns reinforce this. Traders return to charting platforms repeatedly throughout the day, not just to check price, but to refine levels, reassess structure, and update bias as conditions change. That repeated interaction is exactly what TradingView style charting is built for.
Mobile behavior adds another layer. Around 60% of retail investors now rely on mobile trading apps as their primary platform for managing investments. That means chart clarity, layout efficiency, and fast switching between timeframes are not optional improvements. They directly affect how quickly a trader can move from observation to action.
Inside Toobit, this translates into a cleaner way to apply tools like MA, EMA, MACD, and RSI without overcrowding the chart, keeping focus on structure rather than noise.
How to access TradingView charts on Toobit
Start by opening the Toobit app and selecting any spot or futures trading pair. Open the chart view, then switch between standard mode and TradingView mode using the chart toggle.
Once inside TradingView mode, the goal is not to immediately add complexity. It is to build clarity. Start simple. Mark a key level, check a higher timeframe, then return to your execution timeframe with more context than you started with.
On mobile, full screen and landscape views help reduce visual clutter, especially when drawing levels or reviewing multiple indicators.
What to check before using a chart setup
A better chart does not guarantee a better trade. The first check is always alignment. Does the timeframe you are analyzing match the way you actually trade?
The second is structure. Levels should be based on repeated reactions, not isolated spikes or emotional candles. If price has respected a zone multiple times, it carries more weight than a single reaction that looks dramatic in hindsight.
The third is confirmation. Indicators should support structure, not replace it. If price action and indicators disagree, the chart is usually telling you to slow down rather than act faster.
Risk definition comes before execution. Every setup should already include its invalidation point before an order is placed. If that level is unclear, the trade itself is incomplete.
A cleaner way to read fast markets
The real advantage of TradingView inside Toobit is not additional functionality. It is reduced friction in decision-making.
When markets move quickly, traders often lose time switching perspectives. From price to indicators, from one timeframe to another, from idea to execution. A structured charting environment reduces that gap, making it easier to stay aligned with a plan instead of reacting to every move.
Upgrade your charting experience with TradingView on Toobit and use it as a way to slow down interpretation so decisions become more deliberate, even when markets are not.


