Clear analysis should not require multiple screens or specialist software. With TradingView Supercharts built straight into Toobit, the usual gaps between analysis and execution are removed, allowing price studies and decision making to happen in one continuous flow.
The entire trading process is streamlined, enabling you to focus more on key market movements, saving time on switching platforms.
This guide walks you through how to use Supercharts tools to read trends, refine your approach, and trade with more confidence on Toobit.
What is TradingView Supercharts
TradingView Supercharts is one of the most advanced web-based charting engines available, built on lightweight HTML5 to deliver fast, interactive visuals across all major devices. Since its launch in 2011, it has become a global standard for accessible, high quality market analysis.
The same Supercharts engine is now embedded directly into Toobit, offering the full analytical toolkit without leaving the platform. This eliminates the usual friction of switching between a chart provider and an execution screen, creating a single workspace where analysis and action align seamlessly.
How to use Supercharts on Toobit
A professional chart can look complex at first glance, but Supercharts is built with a clear, structured layout that is easy to learn. Once the main sections become familiar, navigation feels natural and surprisingly intuitive.
-
The main chart area
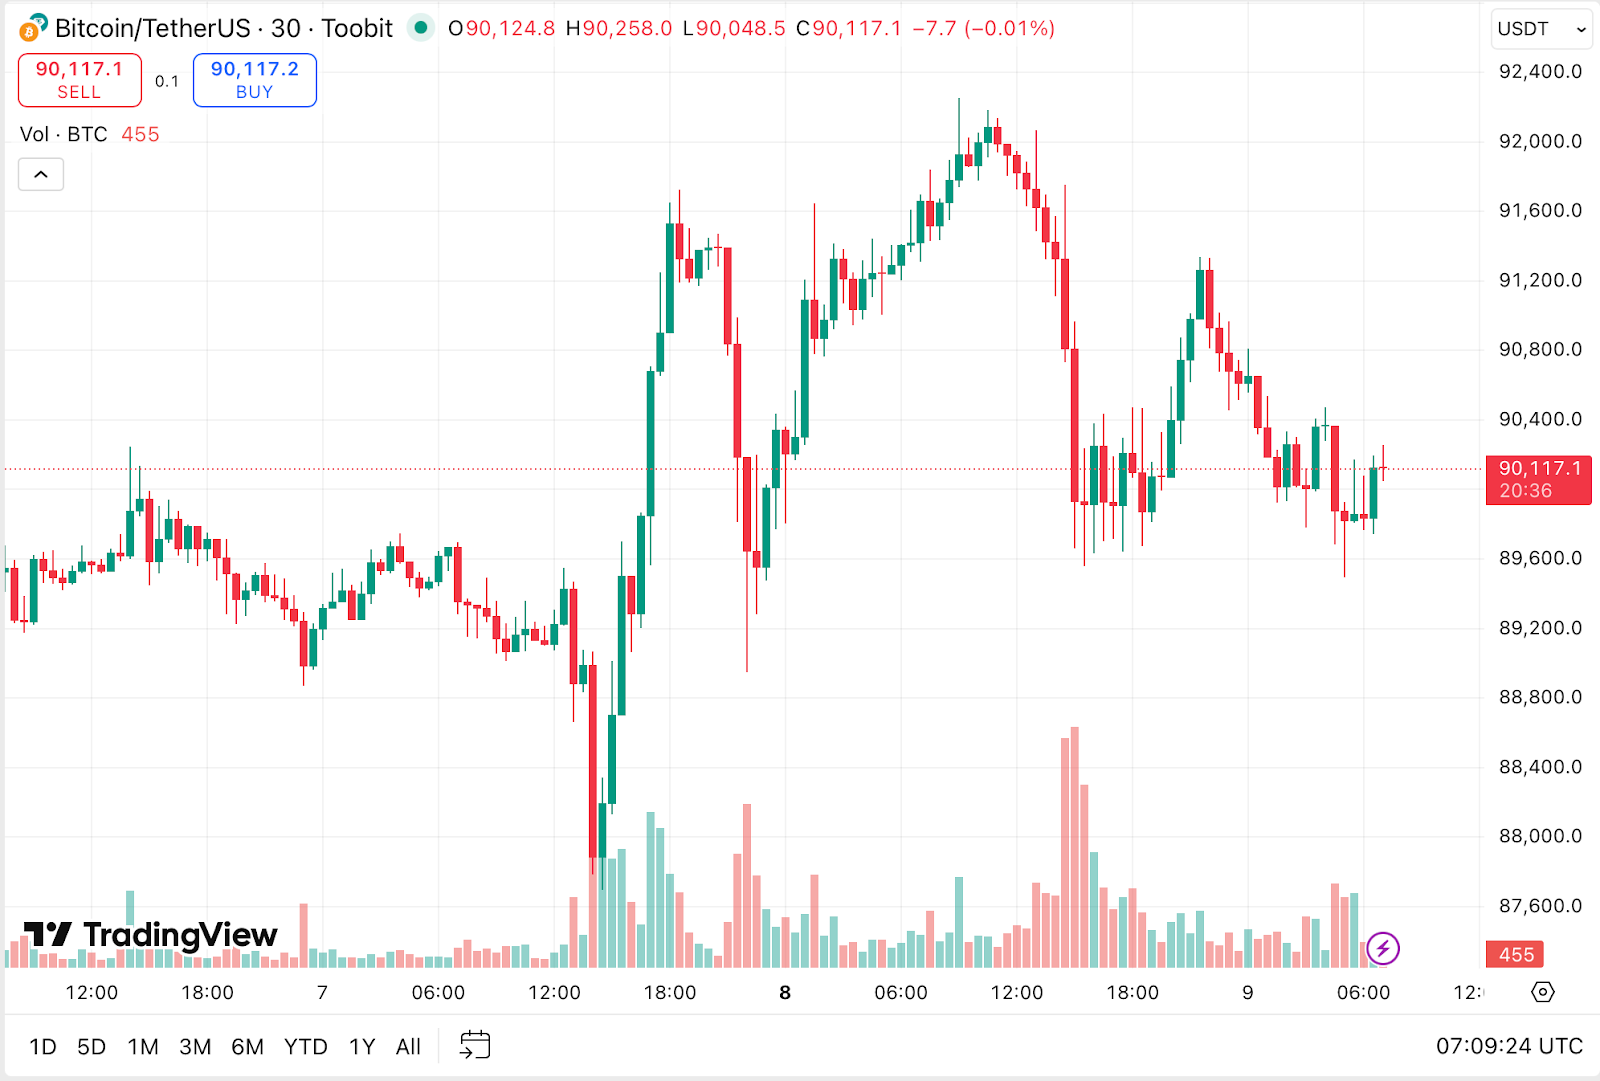
This is the central canvas where price data is displayed. It is fully interactive and supports deep historical exploration or second by second zooming.
-
Navigation: Scroll to adjust the time or price scale. Click and drag to move across time.
-
Context menus: Right click to access display settings, time zone adjustments, and layout customization.
-
Drawing tools on the left sidebar
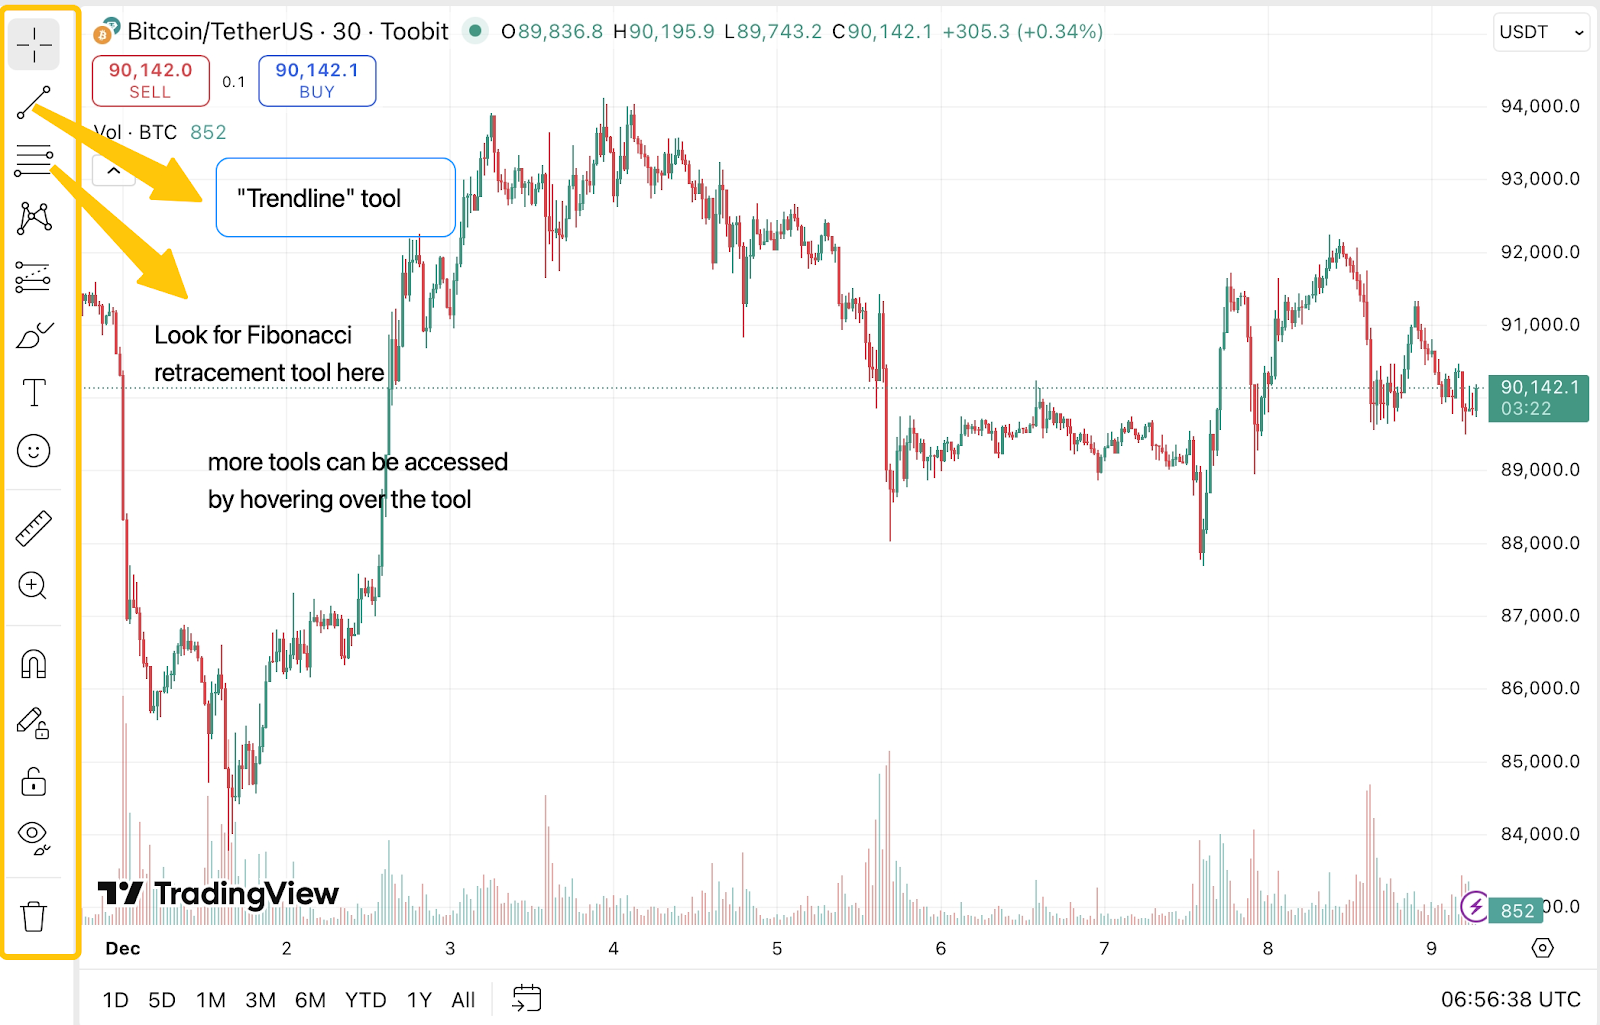
This vertical toolbar contains the markup tools used to annotate the chart.
-
Trendlines and rays: Ideal for identifying support and resistance zones.
-
Fibonacci and Gann tools: Helpful for anticipating potential reversal points using mathematical ratios.
-
Shapes: Rectangles, circles, and zones allow quick highlighting of consolidation areas.
-
Measurement tools: The ruler function measures percentage change, absolute movement, and duration between two price points.
-
Timeframes, styles, and indicators on the top bar
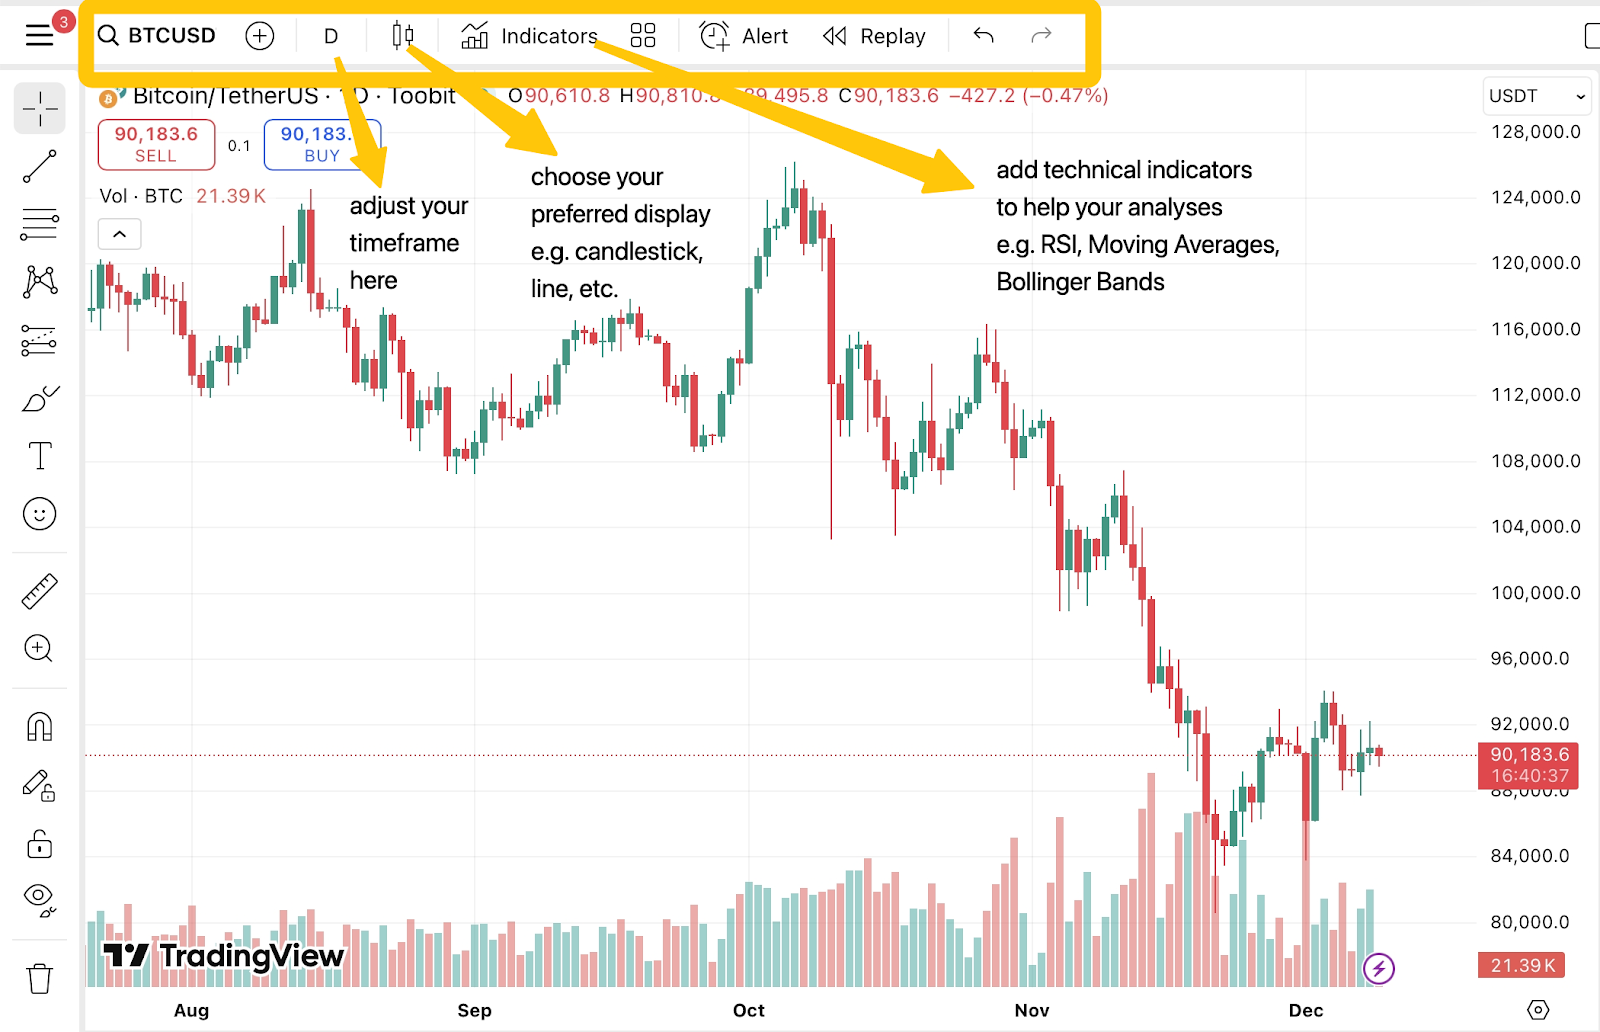
This section defines how market data is presented.
-
Timeframes: Choose anything from 1 minute to 1 month depending on your objective.
-
Chart style: Switch between candlestick, line, area, or Heikin Ashi for cleaner trend visualization.
-
Indicators: Access a large library of established tools such as Relative Strength Index (RSI), moving averages, volume profiles, and volatility bands.
-
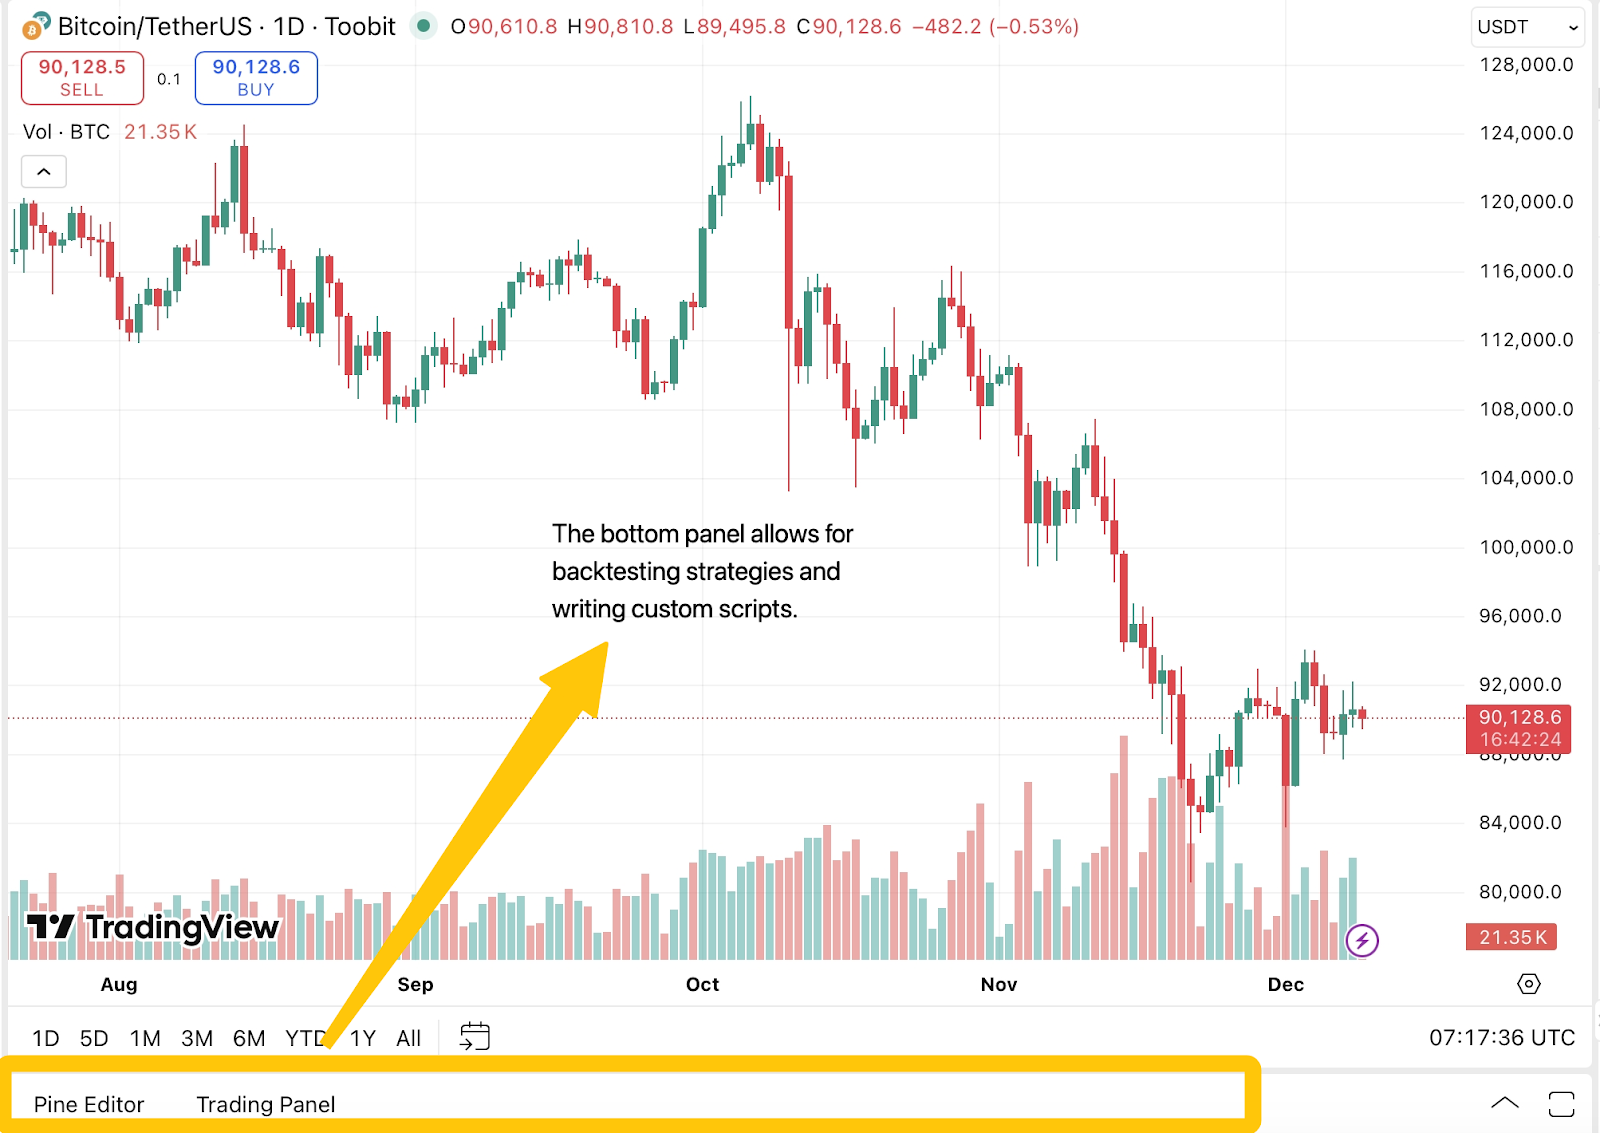
Analysis and automation at the bottom panel
This part unlocks deeper research functions.
-
Strategy tester: Run backtests to see how a strategy would have performed across historical data.
-
Pine Editor: Write custom scripts for completely personalized indicators or signal logic.
Why Supercharts matters
A single price number alone gives limited information. A chart reveals movement, volatility, and structure, which are necessary for evaluating conditions and planning entries or exits with greater accuracy.
-
See real market structure: Candlestick patterns and volatility cues reveal sentiment and momentum that price alone cannot.
-
Plan cleaner entries and exits: Indicators like moving averages, Bollinger Bands, and support levels help pinpoint actionable levels with more accuracy.
-
Use a shared analytical standard: Supercharts matches the chart style used across most market education and commentary, making outside insights easier to follow and apply.
Advantages of using Supercharts on Toobit
This integration offers several practical benefits beyond its polished interface.
-
No installation required: Supercharts runs entirely on HTML5, loading instantly across desktop, mobile, and tablet without downloads, updates, or compatibility issues.
-
Reliable server side alerts: Price alerts operate in the cloud, so they activate even when the device is offline. Notifications can be sent through email or mobile push the moment key levels are hit.
-
A comprehensive free feature set: Toobit provides access to multiple indicators, drawing tools, customization options, and real time data without requiring a subscription. This makes technical analysis more accessible for anyone learning or refining their approach.
-
Pine Script for deeper customization: If a preferred setup does not exist in the default library, it can be created and visualized directly on the chart.
-
Analysis and execution in one place: You can identify a level, review liquidity, and place a limit order all within the same interface. Analysis connects directly to action, keeping attention where it matters.
Final thoughts
Supercharts on Toobit offers one of the cleanest, most capable charting experiences available inside an exchange interface. By understanding the layout and practicing with the built-in tools, anyone can upgrade their analysis from reactive observation to deliberate strategy building.
