At first glance, the BTC price, the price of ADA, and the Dogecoin price live feed can all feel like nonstop noise.
But once you know what each chart is actually showing, the picture gets much clearer. The goal is not to predict every candle. It is to understand what kind of move you are looking at, what is driving it, and whether it is worth acting on.
What is happening to BTC now
If you zoom into Bitcoin's recent move, the message is fairly clear. Bitcoin is trading at $71,291.79, up 6.08% over the past month.
The 1-month chart tells a fairly clean story: BTC pushed up into the mid-$70,000s in mid-March, lost momentum, then slid into a sharper late-March pullback that briefly dragged price toward the mid-$66,000s. Since then, Bitcoin has spent the start of April rebuilding from that dip, and the latest move back above $71,000 suggests buyers have regained some control.
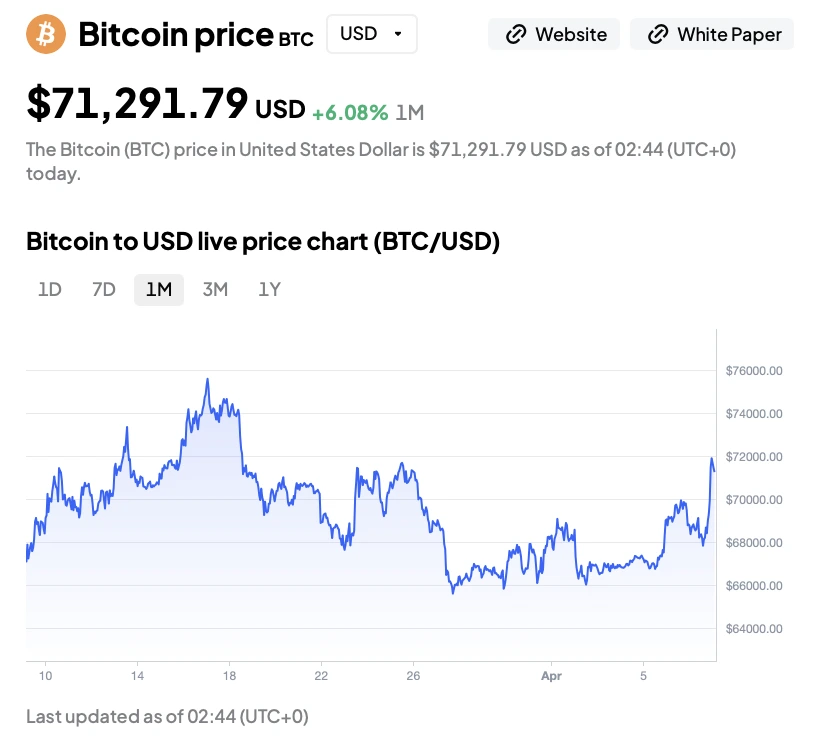
BTC-USDT price across the 1 month. Source: Toobit
As of April 8, that wider context still matters because market sentiment remains deeply cautious.
The Crypto Fear and Greed Index remained in Extreme Fear (score of 17 today) since the start of the month, while U.S. spot Bitcoin ETF flows have been volatile, swinging from inflows of $471.4 million to outflows of $142 million within the same week. That kind of swing usually shows a market that wants to stabilize, but is still taking its cues from larger risk sentiment rather than moving on pure momentum alone.
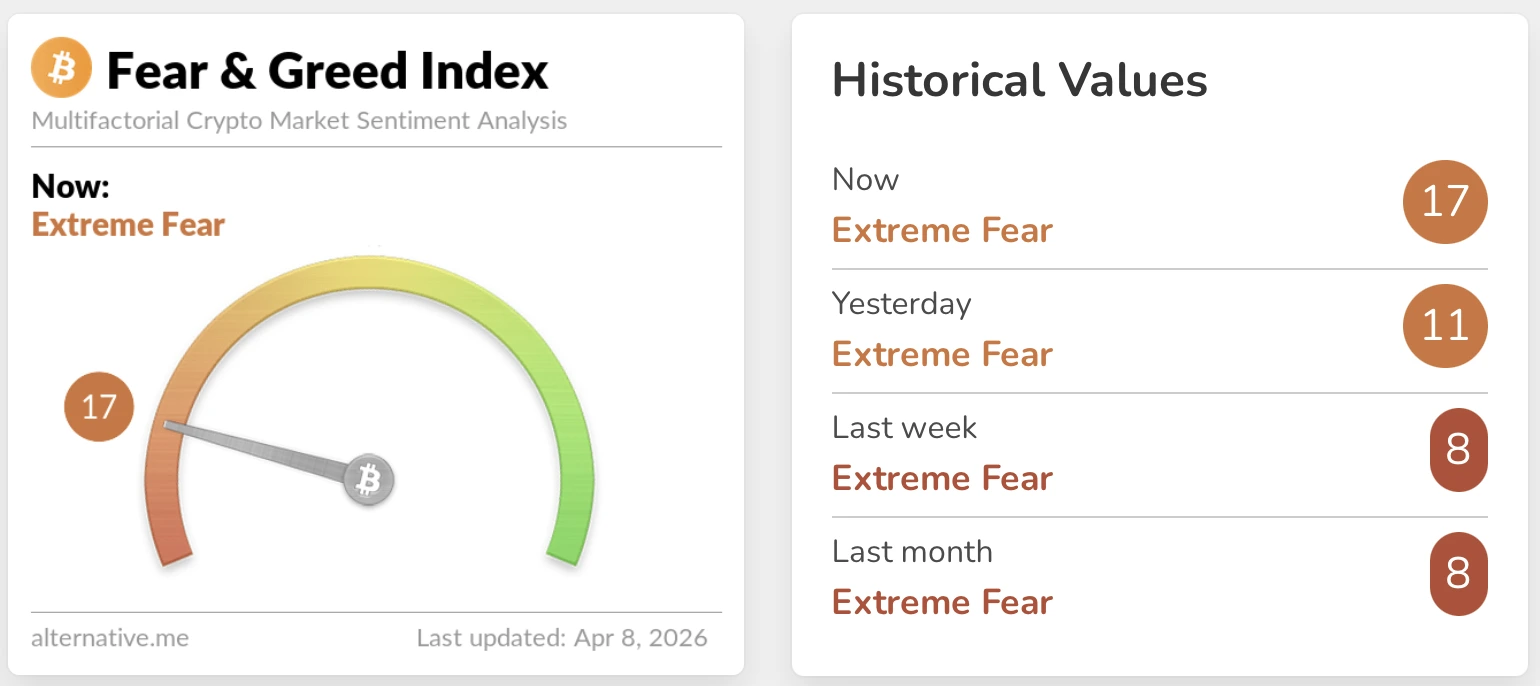
Crypto Fear Greed Index for April 8, 2026. Source: Alternative.me
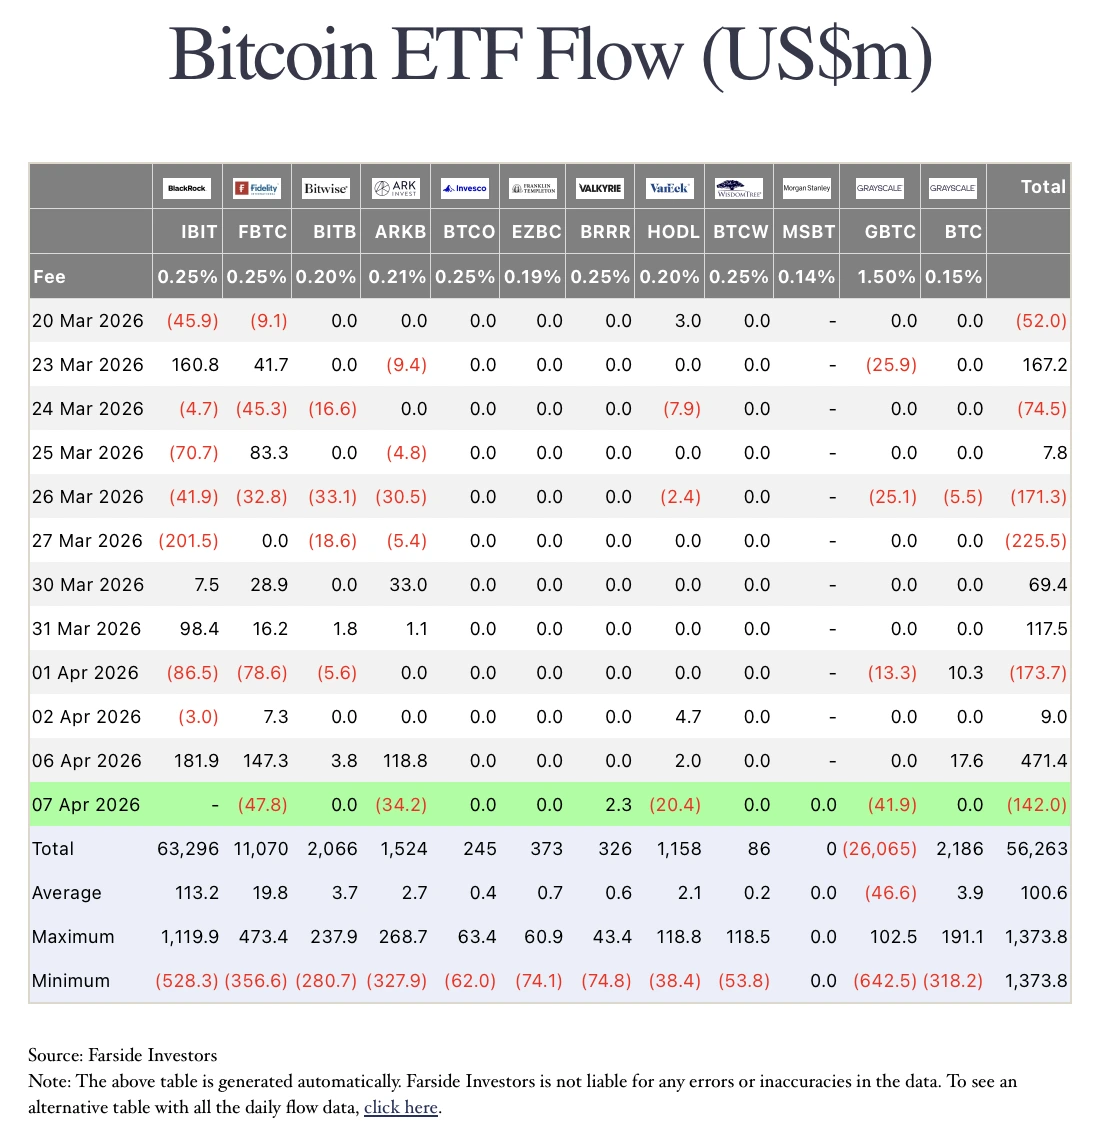
Daily Bitcoin ETF flows. Source: Farside Investors
Additionally, the macro link is fairly direct. CBS News reported that the U.S.-Iran ceasefire pushed oil stocks like Brent down 13.1%, WTI down 14.3%, and S&P 500 futures up 2.3%. For Bitcoin, that matters because falling oil reduces inflation pressure while rising stock futures signal stronger risk appetite.
For long-term context, the Bitcoin Rainbow Chart helps place those moves inside a much bigger valuation picture.
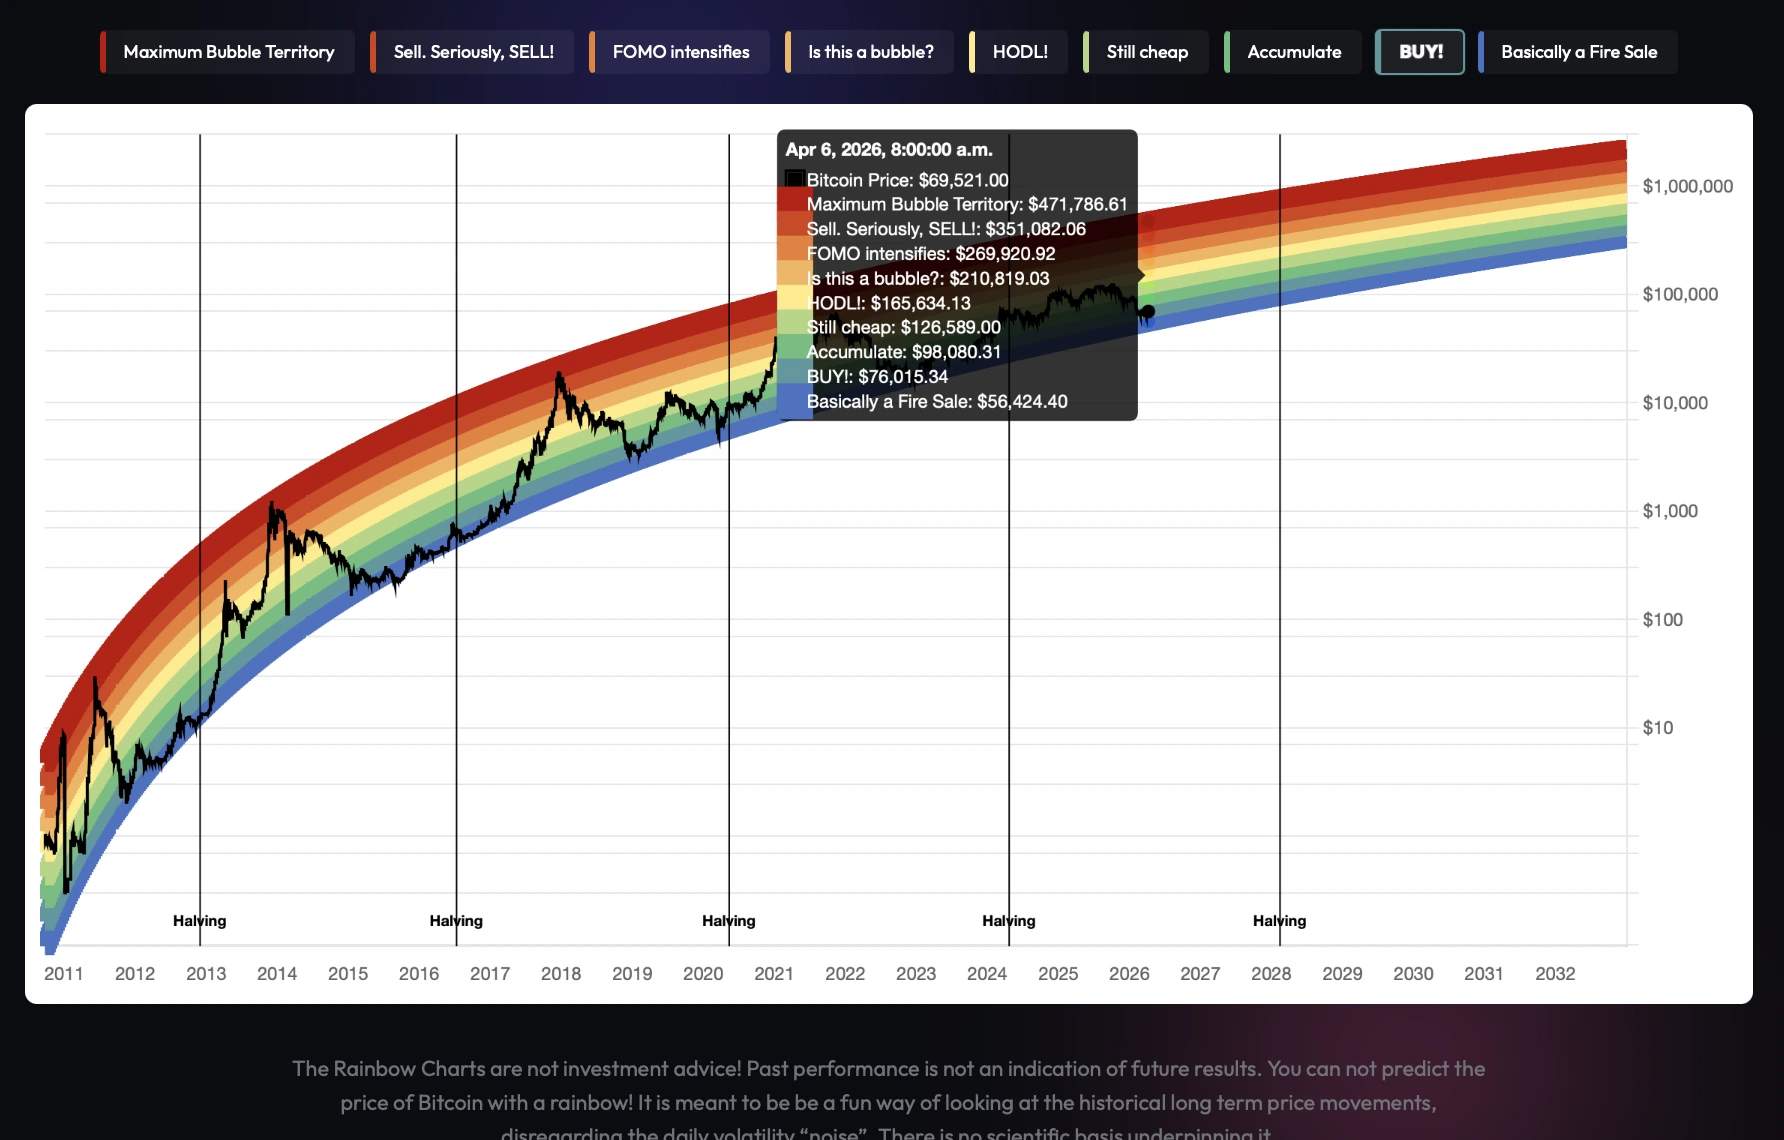
Bitcoin Rainbow Chart. Source: BlockchainCenter
On the current chart, Bitcoin is sitting around the Turquoise "BUY!" area, rather than in the hotter yellow, orange, or red bands associated with stronger speculative excess. In simple terms, that suggests the recent rebound in BTC is happening from a range that has historically looked relatively reasonable on a long-term basis, not from an obviously overheated zone.
Taken together, the message is fairly straightforward. The current BTC chart looks like a volatile market that ran up, cooled off, found support, and is now trying to push higher again. For beginners, that is a far more useful read than simply staring at the latest BTCUSDT price and guessing what it means.
How to start trading Bitcoin (BTC)
Bitcoin's the OG—still king of the hill, still moving markets. Whether you're stacking sats or going full degen with leverage, Toobit gives you everything you need. Spot, Futures, and all the bells and whistles.
How to read ADA live price properly
When beginners look at ADA price charts, price is usually the first thing they notice. The second thing should be volume.
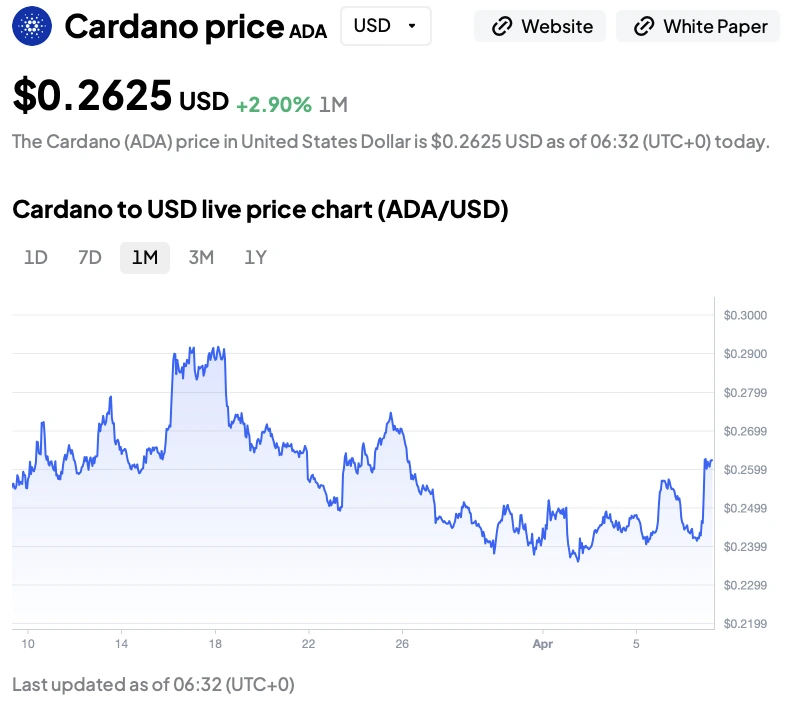
ADA-USDT price across the 1 month. Source: Toobit
Cardano is currently trading at $0.2625, up 2.90% over the past month. ADA pushed toward the $0.29 to $0.30 area in mid-March, lost momentum, then spent late March and early April drifting lower before finding support around the low-$0.24 range. The latest bounce back toward $0.26 suggests buyers are stepping in again, but like BTC, this still looks more like a recovery attempt than a fully confirmed breakout. The bigger question is whether rising activity is turning into a durable trend or just temporary noise.
There is also a regulatory angle that gives ADA more context in 2026. On March 17, 2026, the SEC-CFTC Token Taxonomy listed Cardano among examples of digital commodities. That does not guarantee upside, but it does give the price of ADA a clearer regulatory framework than markets had before.
So how should a beginner read ADA? Start with three checks.
-
Is the price of ADA holding support on a higher time frame?
-
Is volume rising because buyers are stepping in, or because the market is just getting more chaotic?
-
Is ADA moving with broader market support, or trying to rally while the rest of the market still looks shaky? Right now, that last point matters a lot because broader sentiment is still in Extreme Fear territory.
How to start trading Cardano (ADA)
Cardano is where research meets real-world application. If you're ready to dive into a future-focused ecosystem, Toobit gives you a clean, streamlined way to take action.
Will Dogecoin ever be worth anything?
The question "will dogecoin ever be worth anything" gets asked so often it almost answers itself with sarcasm. In 2026, though, DOGE has a more serious backdrop than many people give it credit for.
In the same SEC-CFTC Token Taxonomy, Dogecoin is listed as a digital commodity, which gives it a clearer regulatory frame than before. That does not make DOGE less volatile, but it does make it easier to discuss as a legitimate market asset rather than pure internet chaos.
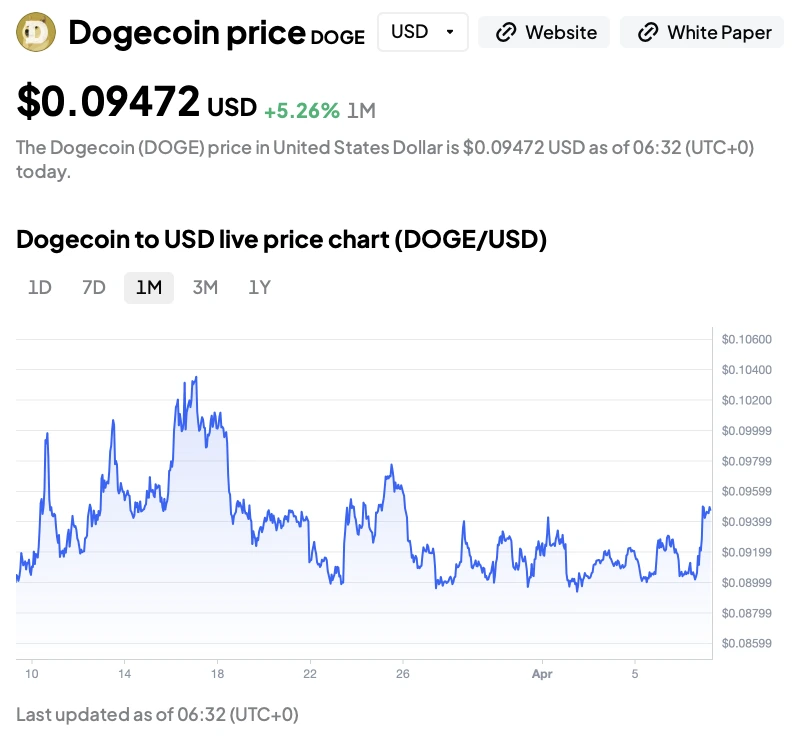
DOGE-USDT price across the 1 month. Source: Toobit
Dogecoin is currently trading at $0.09472, up 5.26% over the past month. The 1-month chart shows a mid-March push toward the $0.10 to $0.104 area, followed by a pullback into late March and early April before stabilizing around the $0.09 range. The latest move back toward $0.095 suggests buyers are stepping in again, and similarly to BTC, this still looks more like a recovery attempt than a clean breakout.
That is the key way to read the Dogecoin price live chart right now. The price of Dogecoin today is not collapsing, but it is also not in full momentum mode. It is stabilizing after a pullback, with sentiment still doing a lot of the work.
Like most meme coins, DOGE should be read with a stricter lens than majors like Bitcoin or ADA. A bounce can be real, but it can also fade fast if the broader market mood turns.
How to start trading Dogecoin (DOGE)
Dogecoin isn't just a meme — it's a movement. If you're ready to ride the DOGE wave in style, Toobit gives you everything from Spot to Futures to make every move count.
From chart reading to the buying process
Reading the chart is the first step. Deciding how to buy comes next.
For Bitcoin, start with BTCUSDT.
Check the live pair, zoom out, and compare the short-term move with the broader BTC Rainbow Chart view. That helps you judge whether the current BTC price looks like strength, weakness, or just noise.
For ADA, the process is similar, but the focus shifts slightly.
If you are asking "how do I buy ADA", start by watching whether the ADAUSDT price is moving with real support or just short-term volatility. The price of ADA fluctuates a lot, which is why buying in stages often makes more sense than chasing one strong candle.
For DOGE, discipline matters most.
The Dogecoin price live chart can move fast, but fast moves are not always strong moves. Before buying, know whether you are entering a breakout, buying a dip, or simply reacting to hype.
The price of Dogecoin today only means something when you know the setup behind it.
The bottom line
Charts do not reward panic. They reward perspective.
Bitcoin, ADA, and DOGE each tell a different story, but the bigger lesson is the same: price makes more sense when you read it with context.
Right now, that means balancing chart structure with macro pressure, sentiment, and regulation, instead of reacting to every move in isolation. The better read is usually the calmer one.
How to buy crypto on Toobit
To buy crypto on Toobit, create an account, complete verification, and go to Buy crypto. Choose a token, select a payment method, and confirm the purchase. Your assets will appear in Spot Account once the transaction settles.
Congratulations, you now know how to purchase crypto on Toobit!
