Is Solana on the verge of a breakout or facing another pause?
Solana is back in focus and traders are watching closely. With SOL price hovering near $85 as of March 2, 2026, the market is asking the same question again: is this a pause before the next leg up, or just another consolidation in a long cycle of volatility?
As network upgrades roll out and institutional interest quietly builds, the price of SOL is once again becoming a central topic in crypto circles.
What is Solana (SOL)?
Solana is often described as an “Ethereum killer,” but it was built with a different design. It is a high-performance blockchain built to support decentralized applications (dApps), smart contracts, and digital assets at scale.
Launched in 2020 by Anatoly Yakovenko, Solana introduced a hybrid consensus model that combines Proof-of-Stake (PoS) with a unique system called Proof-of-History (PoH). The idea? Increase speed without sacrificing decentralization.
According to Solana’s technical documentation, the network was designed to process thousands of transactions per second with low fees, positioning it as a faster alternative to Ethereum during peak congestion periods.
In recent years, upgrades have focused on performance and reliability. One major development is Firedancer, an independent validator client built by Jump Crypto. Firedancer aims to improve throughput and resilience by adding client diversity.
Today, SOL is the native token that powers the ecosystem. It is used to pay transaction fees, stake for network security, and participate in governance. The SOL cryptocurrency price often reflects broader crypto market trends but it also reacts sharply to ecosystem developments and SOL news.
SOL price history and performance overview
To understand any SOL price prediction for 2026, context is essential.
SOL price history
According to data from CoinMarketCap, Solana reached an all-time high (ATH) near $295 in January 2025 while its all-time low (ATL) was around $0.50 in May 2020. After the collapse of FTX in late 2022, SOL price fell sharply.
From that low, SOL began to recover through 2023 and 2024 as network activity improved and new projects launched on the chain. By 2024, it had regained triple-digit prices and re-entered the list of the largest crypto assets by market value. The rebound marked one of the stronger recoveries among major tokens during that cycle.
Historically, SOL price charts show a pattern of strong rallies followed by steep corrections. The SOL price movement tends to accelerate during periods of high retail interest and non-fungible token (NFT) or decentralized finance (DeFi) booms.
SOL’s latest performance
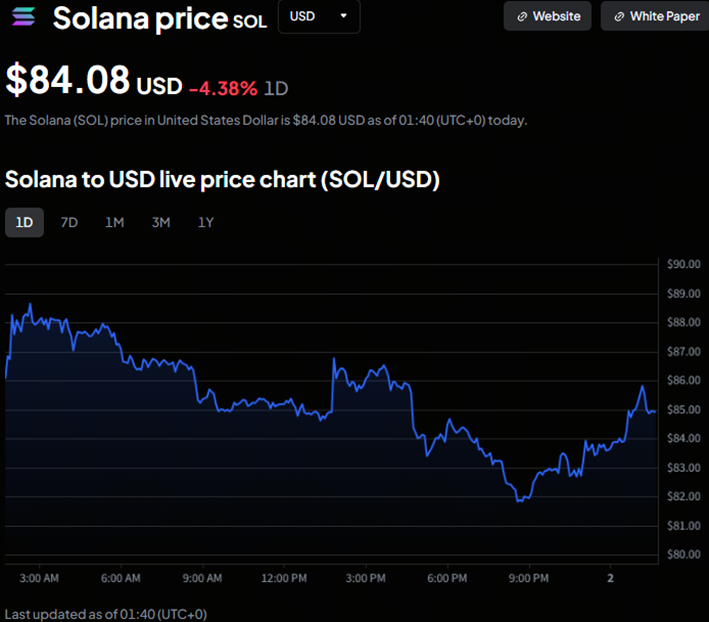
SOL price from Toobit, as of March 2, 2026, 01:40 UTC
In recent market cycles, SOL has moved in sharp rallies followed by periods of consolidation. These fast price swings have attracted active traders, while long-term holders have focused on network growth and adoption.
As of early 2026, Solana remains one of the most used Layer 1 networks by transaction count and daily active addresses, based on public blockchain data dashboards. Price action continues to reflect both broader crypto market trends and activity within the Solana ecosystem.
Current market snapshot (March 2, 2026, 09:40:32 UTC+8)
Let us start with the numbers because speculation without data is just noise.
The SOL price movement shows mild intraday volatility. After testing the $88–$89 range, price retraced toward $82 before stabilizing near $85. Volume remains healthy, suggesting sustained trading interest rather than thin liquidity spikes.
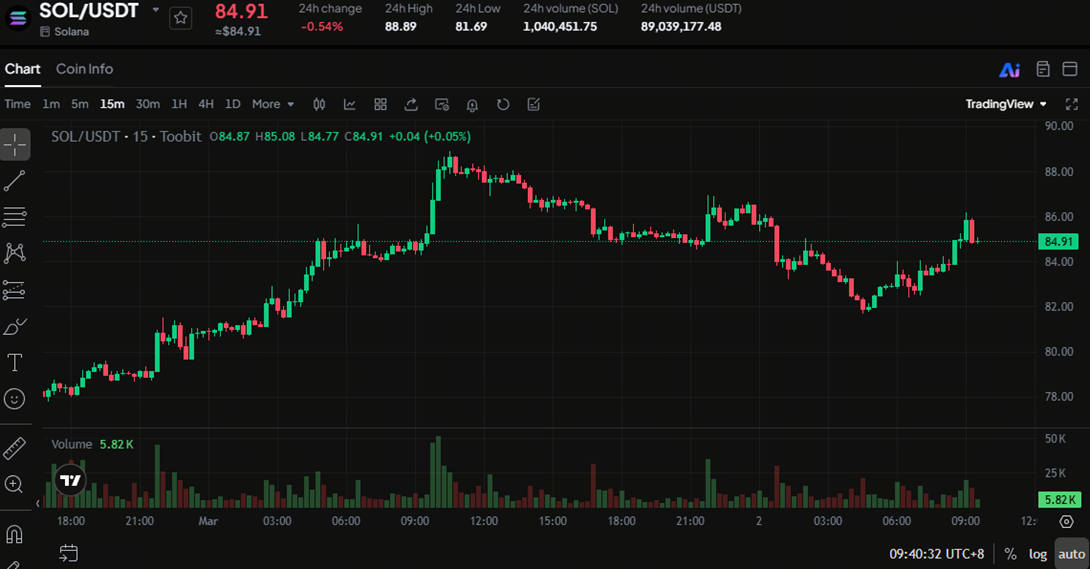
Based on the attached SOL/USDT 15-minute chart:
-
Current SOL Price: $84.91
-
24-hour change: -0.54%
-
24-hour high: $88.89
-
24-hour low: $81.69
-
24-hour volume (SOL): 1,040,451.75 SOL
-
24-hour volume (USDT): $89,039,177.48
From a short-term perspective, the price of SOL is consolidating after a sharp upward push seen earlier in the session. That consolidation phase is often a precursor to either continuation or a pullback depending on broader market momentum.
On-chain and technical analysis
So what are the SOL price charts telling us?
Support and resistance
Over the past several months, the 200-day Exponential Moving Average (EMA) has acted as a key support zone. Price pullbacks have often stabilized near this level, making it an area many traders monitor.
On the upside, the $200–$210 range has acted as near-term resistance. A sustained move above that zone could open the path toward previous cycle highs, while failure to break it may lead to another period of sideways trading.
Short-term trend: Neutral-to-bullish consolidation
If SOL reclaims and holds above $90 on higher volume, technical traders may target the $95–$100 range. A breakdown below $81 could shift momentum toward the $75 region.
Momentum indicators
The Relative Strength Index (RSI) is currently near 58 on the daily chart. This places SOL in neutral territory: above oversold levels but below the typical overbought threshold of 70.
Momentum is positive but not stretched. This suggests room for movement in either direction, depending on broader market conditions.
Moving averages and volume
A prior crossover of the 50-day moving average above the 200-day moving average, often referred to as a “golden cross”, signaled a shift in long-term trend earlier in the cycle. While not a guarantee of continued gains, this pattern is widely followed as a bullish indicator.
Trading volume rose during the recent rally and has eased during consolidation. This pattern often reflects profit-taking after strong moves, rather than immediate trend reversal.
On-chain cues
On-chain metrics matter too. Network activity, validator counts, and transaction throughput remain strong relative to 2023 levels. According to Solana’s public data dashboard, daily transactions frequently exceed 100 million per day, reinforcing network utility.
Daily active addresses and transaction counts remain high compared to many other Layer 1 networks. These metrics suggest that user activity continues even during price consolidation.
Taken together, chart signals and on-chain data point to a market that is cooling after gains but still supported by steady network usage.
Solana price prediction and outlook
Based on historical cycles, current consolidation, and on-chain strength, a balanced SOL price prediction for 2026 would consider multiple scenarios:
Bull case
In a strong market environment, SOL could break above the $100 level and build support there. A sustained move higher may open the door for a retest of the $120–$150 range, especially if:
-
Bitcoin trends upward and draws capital into altcoins
-
Spot and derivatives volume increase
-
On-chain metrics such as Total Value Locked (TVL) and active addresses continue to grow
In past cycles, SOL has shown the ability to move quickly once resistance levels are cleared. A breakout would likely require both market-wide momentum and continued ecosystem growth.
Base case
In a neutral environment, SOL may trade within a broad range between $70 and $110. This scenario assumes:
-
Steady but slower network expansion
-
Stable macro conditions
-
No major liquidity surge or shock
Range-bound markets often follow large rallies. In this case, price action may remain choppy, with traders focusing on support and resistance rather than long-term trend moves.
Bear case
If macro conditions tighten, such as higher interest rates, lower liquidity, or risk-off sentiment, SOL could revisit support near $60. In previous downturns, major altcoins have retraced sharply when capital flows out of the sector.
A move toward that level would likely coincide with broader crypto weakness rather than Solana-specific issues.
The SOL cryptocurrency price remains closely correlated with Bitcoin and overall market liquidity. When Bitcoin gains strength, capital often rotates into large-cap altcoins like Solana. When liquidity contracts, the reverse tends to happen.
For this reason, traders should track macro indicators such as central bank policy, bond yields, and global risk sentiment alongside Solana ecosystem developments.
This article is for informational purposes only and does not constitute financial advice. Always do your own research (DYOR) before making any decisions.
Key milestones for SOL
-
March 2020: Solana launched its Mainnet Beta, marking the start of the live network. The launch introduced its PoH system combined with PoS.
-
September 2021: During the 2021 crypto bull market, SOL climbed rapidly alongside other major assets and reached its previous ATH near $260.
- November 2022: After the collapse of FTX, SOL experienced heavy selling pressure due to the exchange’s close ties to the ecosystem, leading to a significant drop in SOL’s value.
-
January 2023: The price of SOL fell to around $8 (largely due to FTX’s collapse in late 2022). This marked one of the steepest drawdowns among major Layer 1 tokens during that cycle. The recovery from this level became a key turning point for market sentiment.
-
January 2025: SOL reached an ATH near $295 due to a mix of strong market conditions and ecosystem growth.
-
August 2025: The Solana Seeker, the second-generation web3 smartphone from Solana Mobile, was announced in September 2024 and officially began global shipping in August 2025.
-
Q4 2025: Full Firedancer (an independent validator client developed by Jump Crypto) client went live and reported testnet performance reaching 1 million transactions per second (TPS) in controlled conditions. The milestone drew attention to Solana’s scalability roadmap.
-
January 2026: The native SKR token for the Solana Mobile ecosystem was launched. It serves as the primary governance and utility asset for the Solana Seeker phone.
Each milestone significantly impacted SOL price movement. External events, particularly exchange collapses and macro policy shifts, have historically had outsized effects.
Community sentiment and SOL news
Recent SOL discussions focus on whether Solana can close the gap with Ethereum. Ethereum still leads in TVL and overall liquidity. However, Solana has at times surpassed Ethereum in daily active addresses and decentralized exchange (DEX) volume during high-activity periods in 2025 and early 2026.
Market sentiment has shifted from survival concerns after 2022 to competition and market share. Activity in DeFi, trading, and consumer apps has supported this change in narrative.
Some skeptics still point to past network outages. However, infrastructure improvements and validator diversity have reduced those concerns over time.
In short, the debate is no longer about whether Solana will remain relevant. It is about how much market share it can gain if network activity and capital inflows continue.
The bottom line
Solana is no longer a new project. It has gone through a full market cycle, dealt with fallout from the FTX collapse, and rolled out several network upgrades. It is still operating and building.
The current SOL price reflects both growth expectations and past volatility. For beginners, the lesson is simple: price charts show market structure. On-chain data shows network activity. News shapes short-term sentiment.
In crypto, all three influence price.
If 2026 has shown anything so far, it is that steady decisions tend to work better than emotional ones.
How to start trading Solana (SOL)
Solana is not just fast, it is lightning. From meme launches to serious DeFi, SOL is where the action lives. If you are ready to ride the high-speed rails, Toobit makes trading Solana simple. Spot, Futures, and the full pro toolkit are all at your fingertips.
