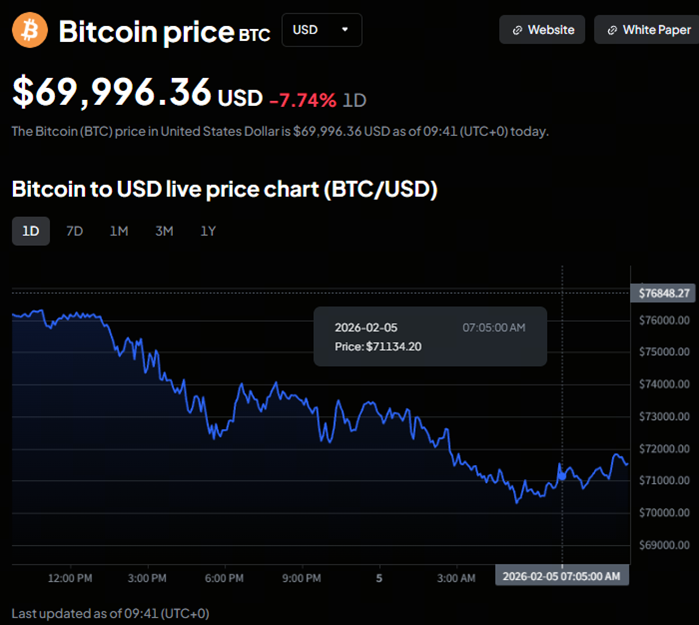
This week, Bitcoin (BTC) drops below $72,000, triggering sharp losses across major cryptocurrencies. Altcoins slide deeply as market volatility intensifies amid heavy selling pressure. The move caught leveraged traders off guard and cracked the calm that had been building across risk markets.
The bigger question now is not “who’s right?” It is: what does this volatility actually signal and how should traders respond?
When “Digital Gold” starts acting like risk again
Bitcoin’s “digital gold” label works well in bull markets and conference decks. It works less well during macro stress.
The latest selloff did not come out of nowhere. Recent geopolitical tensions involving the U.S. and Iran, as well as policy uncertainty, pushed traditional risk indicators higher. A big trigger was renewed macro stress tied to Federal Reserve leadership expectations and rate policy outlook.
Reports that Kevin Warsh is a leading candidate for the next Fed Chair unsettled risk markets. He is widely viewed as policy-tightening friendly, which usually signals less liquidity ahead, not exactly what risk assets like to hear.
When markets start pricing in tighter conditions, Bitcoin tends to react like a growth asset, not a shelter. It does not drift lower, it drops fast. That pattern showed up again this week. As of February 5, 2026, 09:41 (UTC +0), BTC price has dropped below $70,000.
Correlation data tracked by major market desks shows Bitcoin’s relationship with equities tends to rise during liquidity stress, not fall. In plain terms: when global liquidity tightens, Bitcoin often moves with risk, not against it.
The “digital gold” label sounds good in theory, but in practice Bitcoin still trades like a liquidity-sensitive asset when credit conditions shift.
Meanwhile, physical gold has held up better during recent tension-driven moves, supported by central bank buying and demand for traditional hedges. Bitcoin, by contrast, followed risk appetite and liquidity expectations lower.
The takeaway is not that Bitcoin failed. It is that the safe-haven story is conditional, and right now, macro still sets the tempo.
Liquidations and falling open interest accelerated the crash
Another key driver behind the selloff was the surge in liquidations alongside a sharp drop in futures open interest.
The break below $72,000 was not just regular selling; it was leverage unwinding in real time.
In the weeks leading into the drop, open interest across major derivatives venues had climbed to stretched levels. That is usually a warning sign.
When positioning gets crowded and traders lean too hard on leverage, price does not need much of a push to start a chain reaction. Once support failed, the selling became mechanical. Liquidation engines kicked in and forced positions closed.
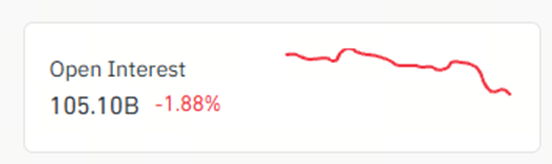
According to data from CoinGlass, futures open interest fell to a low of about $113 billion, signaling that positions were being closed fast as price moved lower. At the time of writing, it has plunged to around $105 billion.
When open interest drops during a selloff, it usually means leverage is getting flushed out rather than new shorts piling in. At the same time, liquidations spiked.
This is how fast markets reset when leverage runs ahead of liquidity. It is not personal. It is math.
Altcoins bleed first, recover last
When Bitcoin lost footing, the rest of the board did not just drift lower, it followed fast. Altcoins slide deeply as market volatility intensifies amid heavy selling pressure. That is the pattern in most risk-off moves: capital exits the thinner books first.
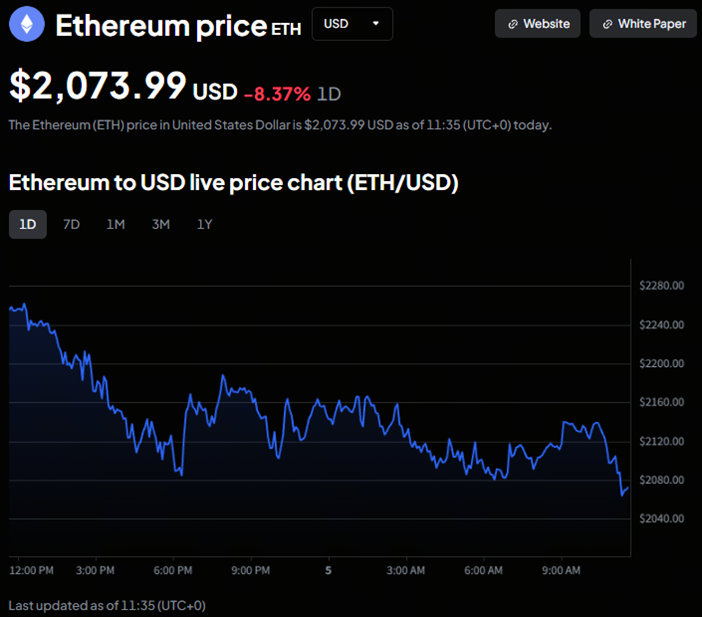
Ethereum (ETH) has traded near the low $2,000 range during the selloff, well below its late-2025 highs. As of February 5, 2026, 11:35 (UTC +0), ETH price has dipped to around $2,000.
CoinMarketCap and CoinGecko breadth data during prior drawdowns shows a consistent pattern: when Bitcoin drops hard, the majority of altcoins underperform BTC on a relative basis.
Trading flow data across major decentralized exchange (DEX) sectors shows rising activity in infrastructure-linked tokens, including perpetual DEX and AI-linked utility projects.
Over recent months, on-chain volume in these segments has climbed while many legacy altcoins have lost relative share. That suggests some traders are shifting from narrative trades toward tools and platforms that generate usage fees.
Why do some smaller tokens still rise in a crash?
Even in a broad selloff, a few charts stay green. Select smaller tokens gain despite a broad market downturn. That usually happens for three reasons:
-
Project-specific news (listings, integrations, token unlock changes)
-
Liquidity rotation into niche narratives
-
Short squeezes in low-float tokens
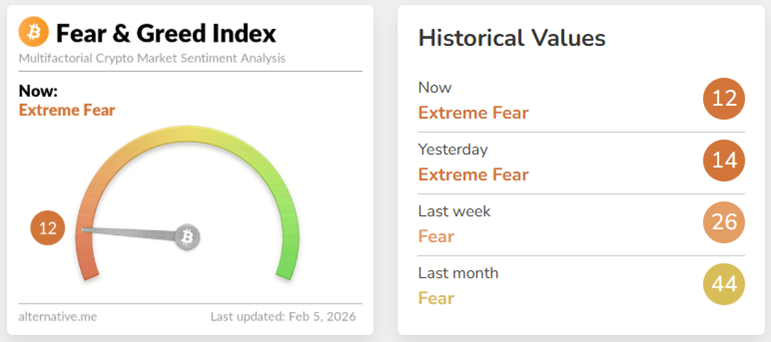
Sentiment gauges like the Crypto Fear and Greed Index have recently printed “extreme fear” readings, according to public trackers, which often line up with sharp volatility and uneven price action across sectors.
A few smaller segments, including decentralized physical infrastructure networks (DePIN) and SocialFi, have shown pockets of strength on certain days, driven mostly by project updates and concentrated trading flows rather than broad demand.
Some AI-agent and infrastructure-linked tokens have also held up better than the average altcoin during parts of the drop. That does not mean they are immune, just that attention and liquidity have not left them yet.
The bigger shift is behavioral. Traders are no longer treating the entire space as one trade. There is more separation between projects with usage, fees, or hardware links and those running only on narrative.
Volatility indicators are flashing: Here is what to watch
If you want signals instead of noise, watch the structure, not the candles.
Key indicators traders are tracking right now
Derivatives funding rates: When funding flips sharply negative, it often signals overcrowded shorts and possible snap-back rallies. CoinGlass funding dashboards are widely used for this.
Exchange-traded fund (ETF) flow data: Spot Bitcoin ETF flows have become a real liquidity signal. Sustained outflows often line up with price pressure, while steady inflows cushion dips.
Stablecoin supply movement: Changes in stablecoin market size are often used as a rough signal of how much buying power is available in the market. Several academic and industry studies have found that when stablecoin supply grows, crypto trading liquidity often increases afterward.
Order book depth: Thin books mean faster moves. Fragmented liquidity across exchanges increases slippage and exaggerates wicks.
What should traders actually do now?
No hero trades. No revenge trades. No “it has to bounce” trades.
Volatility regimes demand different behavior:
-
Cut position size: Same strategy, smaller risk
-
Respect liquidation zones: Leverage is a privilege, not a right
-
Watch liquidity, not opinions: Flows beat narratives
-
Let structure rebuild: Chop comes before trend
Most losses in high-volatility phases come from overconfidence, not bad analysis.
Cut the leverage, not the plan
When sentiment gauges like the Crypto Fear and Greed Index fall into extreme fear territory, volatility tends to stay high. Oversized leverage in that environment is less strategy, more donation.
Favor tools over hype
In choppy markets, attention shifts toward assets and sectors tied to real usage like infrastructure, settlement rails, and protocol tooling, instead of pure narrative trades. Follow activity and volume, not slogans.
Watch macro signals, not rumors
Fed policy expectations and liquidity conditions still drive risk assets, including crypto. Until rate and balance sheet direction is clearer, expect sharper swings and faster reversals.
The bottom line
When BTC drops below $72,000, triggering sharp losses across major cryptocurrencies, it is not just a price event, it is a structure event. Liquidity tightens. Correlations spike. Leverage gets punished.
The digital gold story did not disappear, but in the short term, macro still drives the bus.
In markets like this, it is not about guessing the exact bottom. It is about protecting your capital so you are still around to trade the bounce.
