Giá Stream until 100M MC
Thông tin thị trường Stream until 100M MC
24 giờ Thấp nhất --
24 giờ Cao nhất --
Giá Stream until 100M MC trực tuyến hôm nay tại USD
1 LIVE có giá trị bao nhiêu tại ?
Lịch sử giá Stream until 100M MC
Tại sao giá Stream until 100M MC luôn biến động?
Giá của bất kỳ tài sản nào được giao dịch trên thị trường mở, bao gồm Stream until 100M MC, đều được xác định bởi cung và cầu. Nếu nhiều người muốn mua Stream until 100M MC hơn bán tại một mức giá, giá sẽ tăng. Ngược lại, nếu nhiều người muốn bán hơn mua, giá sẽ giảm.
Cán cân liên tục giữa người mua và người bán tài sản số này chính là lý do cơ bản khiến giá biến động, và đôi khi diễn biến này có thể nhanh trong thị trường tài sản số.
Những yếu tố nào ảnh hưởng đến biến động giá Stream until 100M MC?
Hiệu suất Stream until 100M MC có thể chịu ảnh hưởng từ một số yếu tố chủ chốt liên quan đến công nghệ và cộng đồng. Sự phát triển liên tục của công nghệ nền tảng Stream until 100M MC rất quan trọng, vì các cập nhật thêm chức năng mới hoặc cải thiện hiệu suất có thể tạo ra sự quan tâm tích cực. Một yếu tố đáng kể khác là mức độ chấp nhận, tức là tốc độ người dùng mới bắt đầu nắm giữ và sử dụng.
Số người dùng đang tăng, hoặc số lượng ví hoạt động Stream until 100M MC gia tăng, đều cho thấy mạng lưới đang phát triển tốt. Bên cạnh đó, các ứng dụng thực tế của tài sản số cũng đóng vai trò quan trọng. Tài sản số càng hữu dụng trong thực tế thì giá trị cộng đồng ghi nhận càng lớn, mặc dù giá vẫn có thể tăng ngắn hạn nhờ tác động tiếp thị.
Ngoài hệ sinh thái Stream until 100M MC, xu hướng thị trường rộng hơn và nhận thức công chúng cũng ảnh hưởng tới giá trị. Tâm lý chung trên thị trường tài chính và tin tức liên quan tài sản số có thể khiến giá Stream until 100M MC biến động. Những thông báo lớn, truyền thông, hay bàn luận rộng rãi trên mạng xã hội cũng làm gia tăng nhận thức và tác động đến kỳ vọng về tương lai Stream until 100M MC. Ngoài ra, thay đổi về mặt pháp lý từ các cơ quan quản lý cũng sẽ ảnh hưởng đến toàn bộ thị trường tài sản số và hiệu suất giá của Stream until 100M MC.
Giá Stream until 100M MC toàn cầu
Làm thế nào để mua Stream until 100M MC

Tạo tài khoản Toobit miễn phí của bạn
Đăng ký trên Toobit bằng địa chỉ email/số điện thoại và quốc gia cư trú của bạn, đồng thời tạo mật khẩu mạnh để bảo vệ tài khoản.

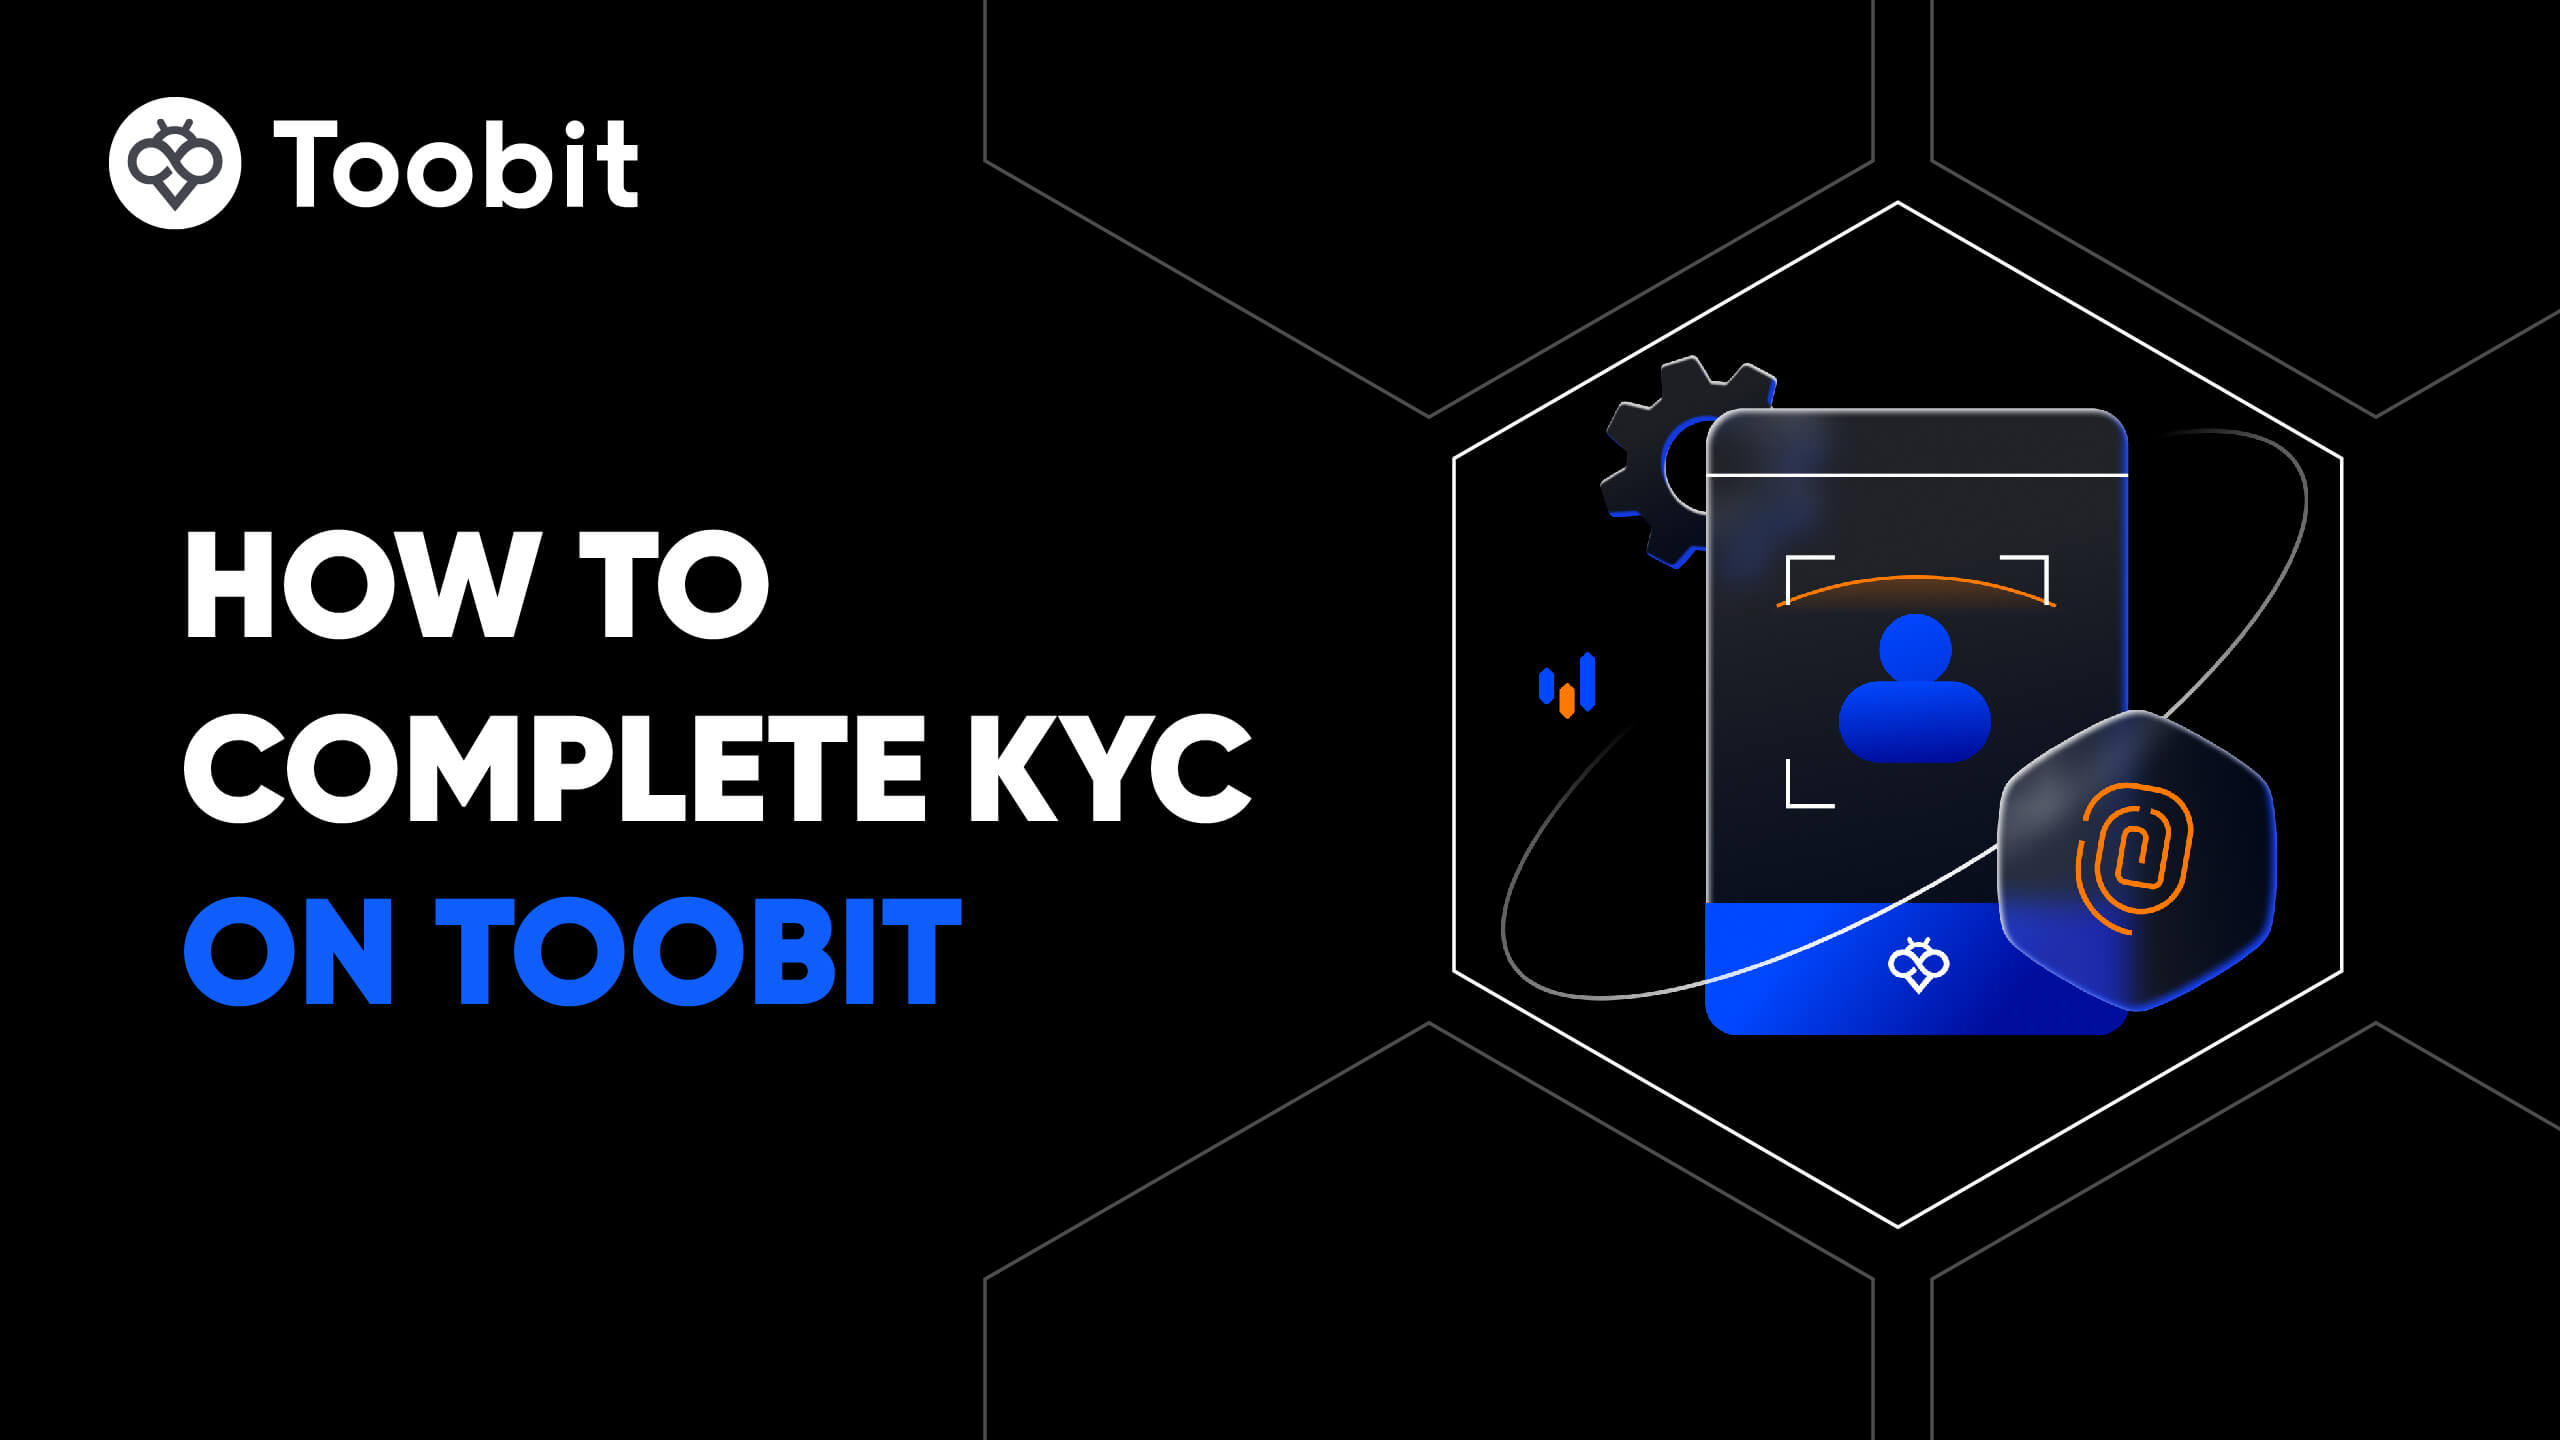
Xác minh danh tính của bạn
Hoàn tất xác minh danh tính bằng cách gửi thông tin cá nhân và tải lên ảnh ID hợp lệ.

Thêm phương thức thanh toán và mua Stream until 100M MC (LIVE)
Thêm thẻ tín dụng/ghi nợ hoặc tài khoản ngân hàng sau khi xác minh tài khoản Toobit của bạn. Sử dụng nhiều tùy chọn thanh toán để mua Stream until 100M MC trên Toobit.
Giao dịch hợp đồng tương lai vĩnh cửu LIVE
Sau khi đăng ký thành công trên Toobit và mua USDT hoặc token LIVE, bạn có thể bắt đầu giao dịch phái sinh, bao gồm futures LIVE và giao dịch margin để tăng thu nhập.
Tham gia giao dịch sao chép LIVE cùng Lead Traders
Sau khi đăng ký trên Toobit và mua thành công USDT hoặc token LIVE, bạn cũng có thể bắt đầu giao dịch sao chép theo Lead Traders.
Tôi có thể mua Stream until 100M MC ở đâu?
Mua crypto trên ứng dụng Toobit
Đăng ký chỉ trong vài phút để mua crypto bằng thẻ tín dụng hoặc chuyển khoản ngân hàng.
Giao dịch trên Toobit
Nạp các loại tiền mã hóa của bạn lên Toobit và tận hưởng thanh khoản cao cùng phí giao dịch thấp.
Phần video — xác minh nhanh, giao dịch nhanh
Cách xác minh danh tính trên Toobit và bảo vệ bạn khỏi lừa đảo
- 1.Đăng nhập vào tài khoản Toobit của bạn.
- 2.Nếu bạn mới sử dụng Toobit, hãy xem hướng dẫn cách tạo tài khoản của chúng tôi.
- 3.Nhấn vào biểu tượng hồ sơ ở góc trên bên phải thanh điều hướng, sau đó chọn trang Xác minh danh tính.
Bộ tính giá LIVE/USD
Xếp hạng
- Ứng dụng
- Google Play
- App Store
- Android APK
- Cộng đồng


© 2026 Toobit.com. All rights reserved.