Цена Stream until 100M MC
Информация о рынке Stream until 100M MC
24-ч минимальная цена --
24-ч максимальная цена --
Текущая цена Stream until 100M MC сегодня в USD
Сколько стоит 1 LIVE в ?
История цены Stream until 100M MC
Почему цена Stream until 100M MC всегда колеблется?
Цена любого актива, который торгуется на открытом рынке, включая Stream until 100M MC, определяется спросом и предложением. Если желающих купить Stream until 100M MC больше, чем продать — цена растет. Если желающих продать больше, чем купить — цена падает.
Это постоянное равновесие между покупателями и продавцами криптоактива — ключевая причина колебания цен; такие скачки могут происходить очень быстро на рынке цифровых активов.
Какие факторы влияют на динамику цены Stream until 100M MC?
На динамику Stream until 100M MC может влиять несколько ключевых факторов, связанных с технологией и сообществом. Важно постоянное развитие подкапотных технологий — обновления с новыми функциями или улучшенной эффективностью вызывают позитивный интерес. Ещё один фактор — уровень внедрения: рост числа новых пользователей, которые начинают владеть или использовать Stream until 100M MC.
Рост пользовательской базы или увеличение активных кошельков Stream until 100M MC обычно характеризует здоровую расширяющуюся сеть. Кроме того, практические сценарии использования играют важную роль: чем полезнее криптоактив в реальной жизни, тем больше сообщество признаёт его ценность — несмотря на спекулятивный рост в краткосрочной перспективе из-за маркетинга.
Помимо экосистемы Stream until 100M MC, на его стоимость влияют более широкие рыночные тренды и публичное восприятие. Общие настроения на финансовых рынках и новости, связанные с цифровыми активами, могут приводить к изменению цены Stream until 100M MC. Важные анонсы, активное освещение в СМИ или обсуждение в социальных сетях увеличивают осведомленность и могут повлиять на ожидания по будущему Stream until 100M MC. Кроме того, регуляторные новости от государственных органов способны затронуть весь сектор цифровых активов, а значит — и динамику его цены.
Глобальные цены Stream until 100M MC
Как купить Stream until 100M MC

Создайте бесплатный аккаунт Toobit
Зарегистрируйтесь на Toobit, указав email/номер мобильного телефона и страну проживания, а также создайте надежный пароль для защиты аккаунта.

Пройдите проверку личности
Завершите верификацию личности, предоставив персональные данные и фото-документ
Добавьте способ оплаты и купите Stream until 100M MC (LIVE)
Добавьте кредитную/дебетовую карту или банковский счет после верификации аккаунта Toobit. Используйте различные способы оплаты для покупки Stream until 100M MC на Toobit.
Торгуйте бессрочными фьючерсами LIVE
После регистрации на Toobit и покупки USDT или токенов LIVE вы сможете торговать деривативами, включая фьючерсы LIVE и маржинальную торговлю для повышения дохода
Присоединяйтесь к копитрейдингу LIVE с лид-трейдерами.
После регистрации на Toobit и успешной покупки USDT или токенов LIVE вы также сможете заняться копитрейдингом, следуя за лид-трейдерами
Где купить Stream until 100M MC?
Купить криптовалюту в приложении Toobit
Зарегистрируйтесь за несколько минут, чтобы купить криптовалюту через кредитную карту или банковский перевод
Торгуйте на Toobit
Внесите ваши криптовалюты на Toobit и пользуйтесь высокой ликвидностью и низкой торговой комиссией.
Видеосекция — быстрая верификация, быстрая торговля
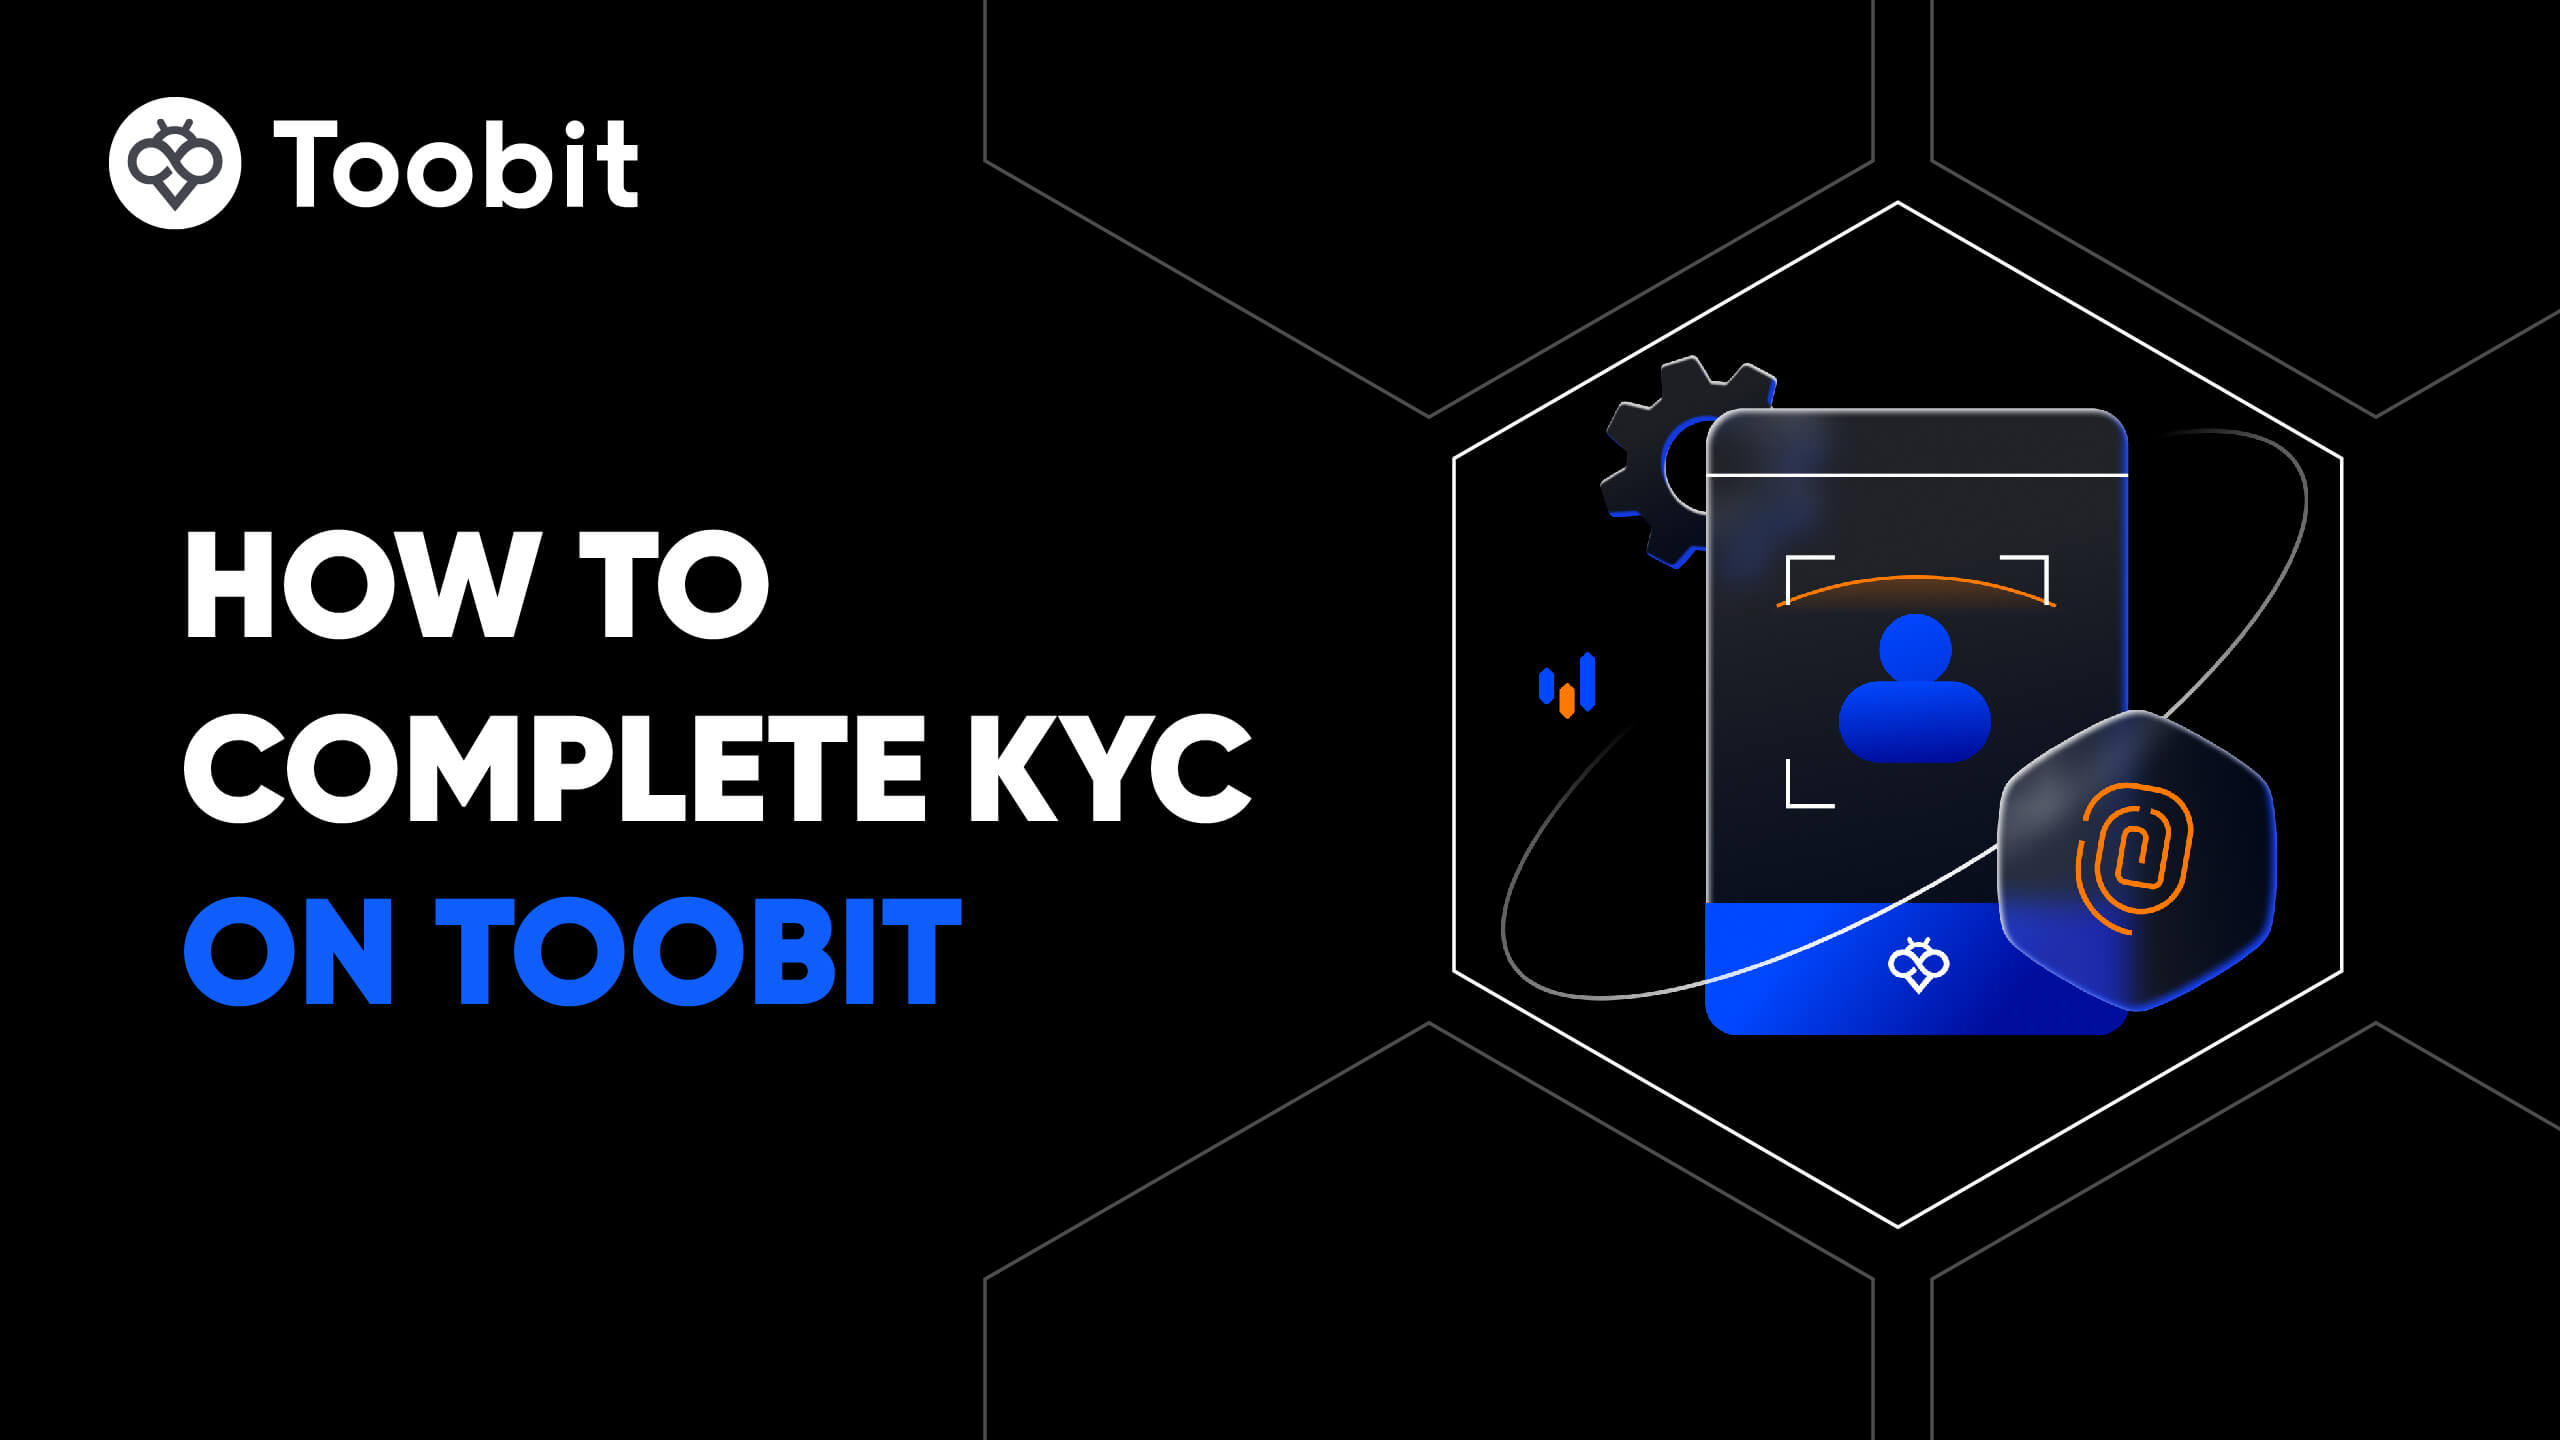
Как пройти идентификацию на Toobit и защитить себя от мошенничества
- 1.Войдите в свою учетную запись Toobit.
- 2.Если вы новичок на Toobit, посмотрите наше руководство по созданию аккаунта.
- 3.Нажмите на иконку профиля в правом верхнем углу навигационной панели, затем выберите страницу идентификации.
Калькулятор цены LIVE/USD
Рейтинги
- Приложения
- Google Play
- App Store
- Android APK
- Сообщество


© 2026 Toobit.com. All rights reserved.